
The nuclear family vs joint family question looks like a social-studies topic, but it is also a data question. How many people live in a home, who lives with whom, and how those numbers change over time can all be measured, and the results say a lot about how societies change. This guide explains the difference between a nuclear and a joint (or extended) family, then checks the ideas against real statistics from the UK, India and the United Nations.
Every figure has its year beside it, because family statistics change slowly but they do change. The article also avoids saying which family type is “better”. Research shows that children and adults can do well in both, and what matters most is the quality of care and relationships, not just the number of people under one roof.
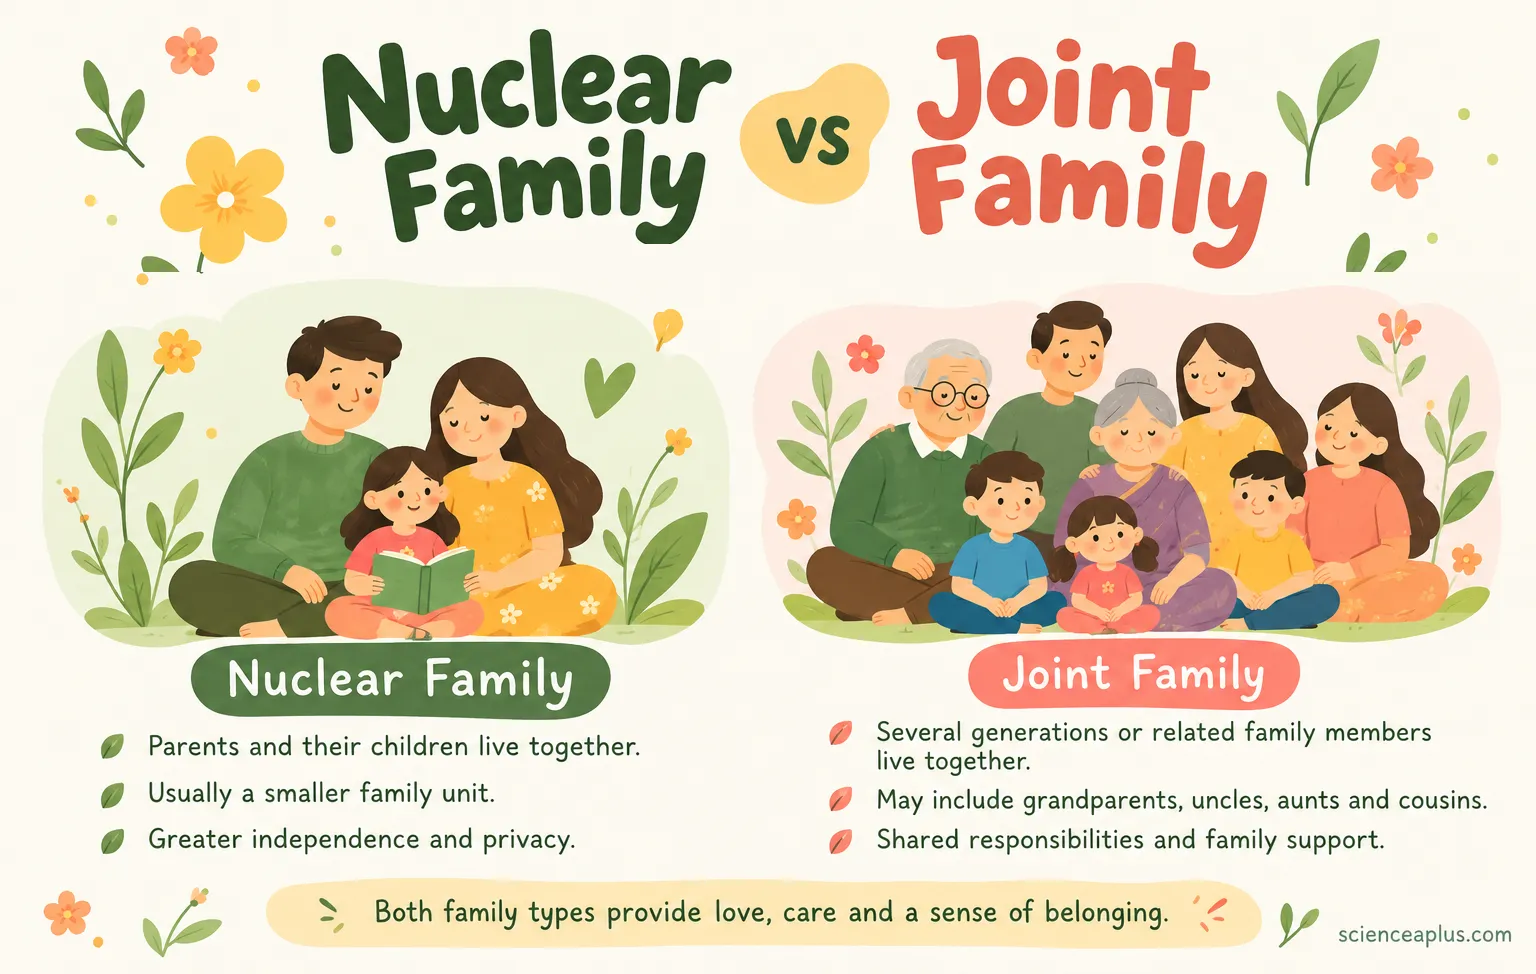
What is a nuclear family?
A nuclear family is a household of parents and their children, or a couple living together, or one parent with children. The word “nuclear” comes from the idea of a core or centre, like the nucleus of a cell. In the UN’s Database on Household Size and Composition, “nuclear households” are defined as the total of three types: couple-only households, couples with children, and single parents with children.
So the word is broader than the picture many people have in mind. A lone parent with two children is a nuclear household in the UN definition. So is a retired couple whose children have grown up and moved out.
What is a joint family or extended family?
A joint family is a household in which several generations or several related couples live together, often grandparents, their sons or daughters, the sons’ or daughters’ partners, and the grandchildren. Many people use “joint family” and “extended family” as near-synonyms, though they are not identical:
- Extended family is the wider group of relatives: grandparents, aunts, uncles and cousins. They may live in the same home, the same street, or in different countries.
- Joint family usually means relatives who share one household, a kitchen and often money and decisions. The term is especially common in South Asia.
- Multigenerational household is the statistical term. The UN database counts a household as multigeneration when it contains two or more generations of related adults aged 20 or over. The Office for National Statistics (ONS) uses a similar idea for England and Wales, describing people from more than two generations of the same extended family living together.
Because researchers define these words differently, two surveys can give different numbers for the same country. Whenever you see a percentage for “joint families”, check how the source defined them.
Nuclear vs joint family: the key differences
The slide below, which sums up the topic, compares the two family types on five points: size, living arrangements, decisions, responsibilities and privacy. The table repeats the main ideas and adds a column showing what researchers can actually measure.
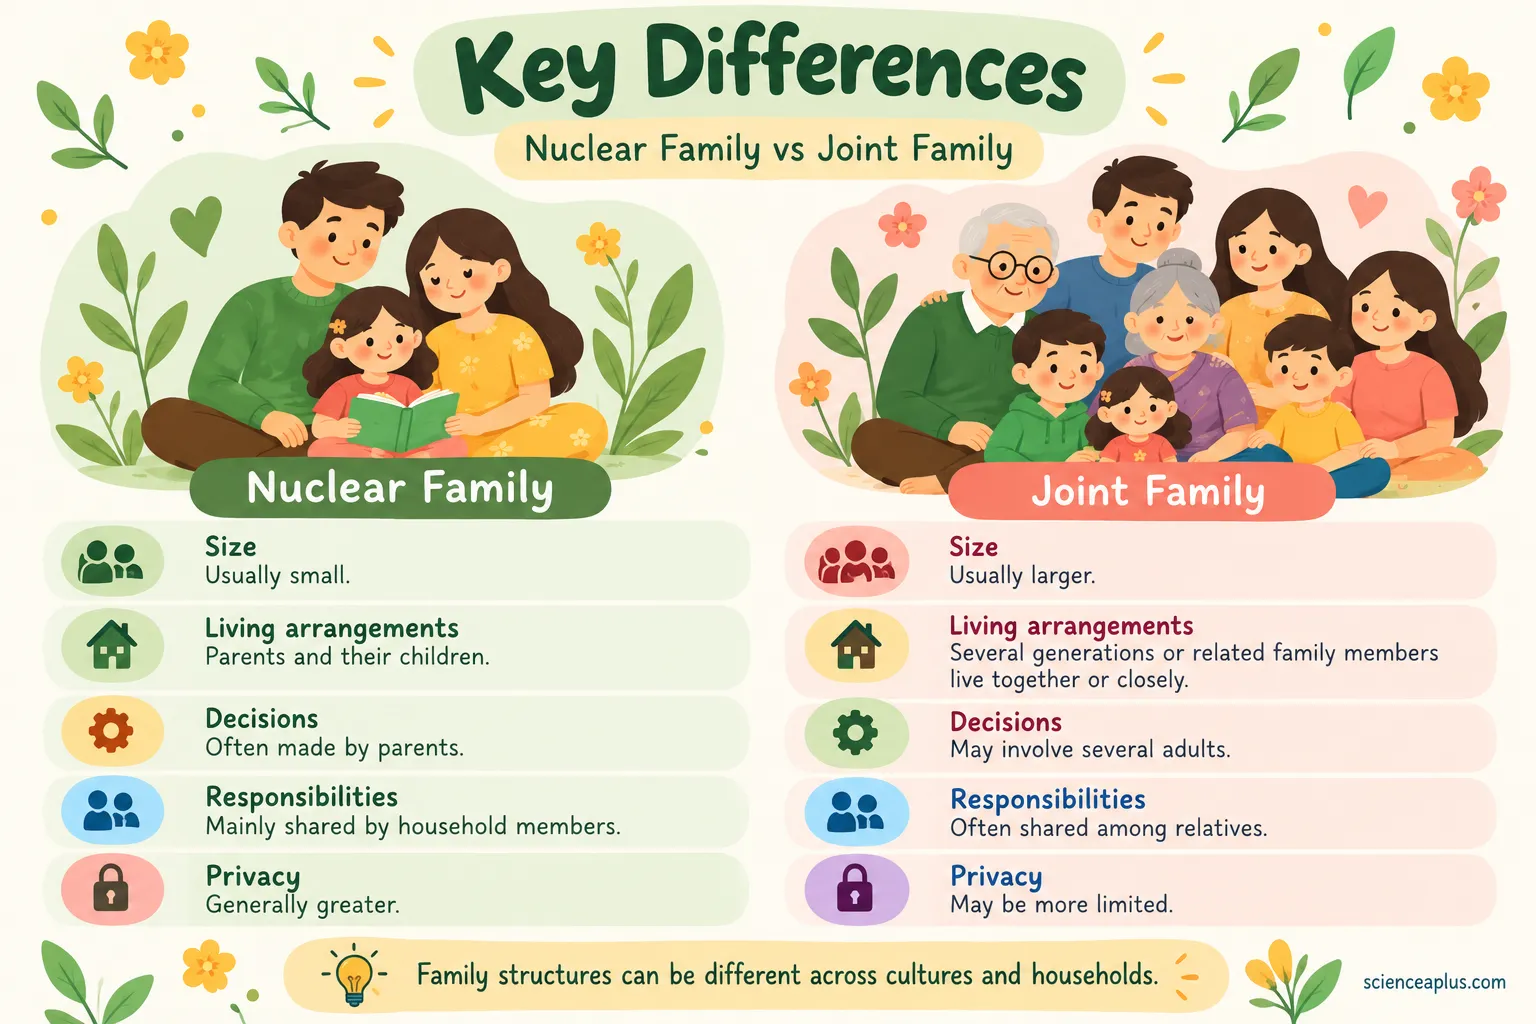
| Feature | Nuclear family | Joint / extended family | How scientists measure it |
|---|---|---|---|
| Size | Usually small | Usually larger | Average number of usual residents per household |
| Who lives together | Parents and their children | Several generations or related couples | Household composition: relationships to the head of household |
| Decisions | Often made by the parents | May involve several adults | Surveys and interviews (harder to count) |
| Responsibilities | Shared by household members | Often shared among relatives | Time-use surveys, caregiving studies |
| Privacy | Generally greater | May be more limited | People per room, bedrooms per person |
Size and who lives with whom can be counted exactly, but decisions and privacy are harder to turn into numbers.
Why measure household size at all?
Household size is a simple number with powerful uses. Governments use it to plan housing, schools and pensions, and demographers use it as a clue to deeper changes such as falling birth rates and rising life expectancy.
The idea is easy to test yourself. If a village has 200 people living in 40 homes, the average household size is 200 ÷ 40 = 5 people. If the same 200 people lived in 80 homes, the average would drop to 2.5, even though nobody was born or died. That is why this number can fall for reasons other than having fewer children: people also move into separate homes.
What the data say: household size around the world
The United Nations Population Division keeps a Database on Household Size and Composition. Its 2026 edition, described in a methodology report issued in August 2026, draws on 1,129 data sources from 200 countries or areas, with reference dates from 1959 to 2025, covering roughly 98% of the world’s population in 2026. In this database, average household size is the average number of usual residents per household.
The main pattern is that household size varies hugely between countries. At the other end of the scale from the UK’s 2025 average of 2.36, the study described below found an average of 8.4 people per household in Senegal.
A 2024 study in the journal Genus by Esteve and colleagues, using the CORESIDENCE database (156 countries, 793 time points, 1970–2020), adds a useful twist. It found that household sizes ranged from 1.8 people in Denmark to 8.4 in Senegal, that household size fell by about 0.5 people per decade on average, and that children accounted for over three-quarters of the variability and decline in household size, while the number of other relatives in households stayed fairly stable or fell only moderately. So average household size can fall mainly because there are fewer children per household, not mainly because relatives have stopped living together.
Household data from the UK and India
Two national data sources make a useful comparison, because they sit at very different points on the scale.
| Measure | United Kingdom | India |
|---|---|---|
| Average household size | 2.36 people (ONS, 2025) | About 4.8 people (Census 2011, calculated: about 1,200.5 million people ÷ 248.4 million normal households); 4.4 in NFHS-5 (2019–21) |
| Number of households | 29.0 million (2025), up from 27.0 million in 2015 | 248.4 million normal households (Census 2011) |
| One-person households | 29.5% (2025), 28.6% (2015) | 4.5% (Census 2011) |
| Nuclear households | Not reported in that form (couple families: 65.3% married, 17.6% cohabiting; lone parents 16.0% of families, 2025) | 52.1% (Census 2011) |
| Joint or multigenerational | 2.1% multigenerational (England and Wales, Census 2021; 1.8% in 2011) | 16.1% “joint” (Census 2011), plus 15.8% “supplemented nuclear” |
The columns come from different years, definitions and methods, so they show a general pattern, not a precise ranking.
India’s 2011 census: more than “nuclear or joint”
The Census of India household table (HH-04) is a fascinating dataset because it does not use only two boxes. It sorts the 248,858,281 households counted in 2011 into seven types. Working out the percentages from the published counts gives:
- Nuclear: 129.7 million households, 52.1%
- Joint: 40.0 million households, 16.1%
- Supplemented nuclear (a nuclear family plus one or more other relatives): 39.3 million, 15.8%
- Sub-nuclear: 12.8 million, 5.1%
- Single person: 11.2 million, 4.5%
- Broken extended: 10.8 million, 4.3%
- Others: 5.1 million, 2.1%
Two lessons follow. First, a little over half of Indian households were already nuclear in 2011, so the idea that India is “all joint families” does not match the census. Second, if you add the “supplemented nuclear” households, which include one or more relatives beyond the nuclear core, the share of homes with relatives beyond the nuclear core is much bigger than 16.1%. How you define “joint” changes the answer.
Rural and urban India were also closer than many people expect. Joint households were 16.8% of rural households and 14.6% of urban households, while nuclear households were 52.1% rural and 52.3% urban.
Why are household sizes falling? Three scientific causes
1. The demographic transition
The demographic transition is a pattern seen in many countries. Death rates fall first, thanks to better food, clean water and medicine, so populations grow. Birth rates then fall as well, as children are more likely to survive, more people are educated and many parents choose smaller families. The result is a society with fewer children per household and a longer life expectancy.
Recent UN figures show how far this has gone. In 2024 global life expectancy at birth was 73.3 years, and more than half of all countries and areas had fewer than 2.1 births per woman, the level usually called replacement fertility. India’s national survey (NFHS-5, 2019–21) reported a total fertility rate of 2.0, down from 2.2 in 2015–16, and national survey reports put average household size at 4.6 in 2015–16 and 4.4 in 2019–21. The two falls fit together, although the surveys alone cannot prove that one caused the other.
2. Urbanisation
People who move to cities often move for work or study, usually as individuals or small families, and housing in cities is smaller and more expensive. The UN’s 2025 World Urbanization Prospects estimated that 45% of the world’s people live in cities, 36% in towns and 19% in rural areas, using a consistent measurement called the Degree of Urbanisation. Using each country’s own definitions, only 58% count as urban, because governments define “urban” differently.

Urbanisation is also often discussed alongside globalisation, because many people move towards jobs in trade and technology. You can explore that link in our guide to globalization: advantages and disadvantages.
3. Rising incomes, education and ageing
Higher incomes can make it easier for people to afford separate homes. In the UK, 29.5% of households in 2025 were one-person households, about 8.6 million people living alone, while 42.4% of people aged 15 to 34 (7.2 million) lived with their parents, up from 39.7% in 2015. Households are being reshaped in both directions.
Advantages and challenges of each family type
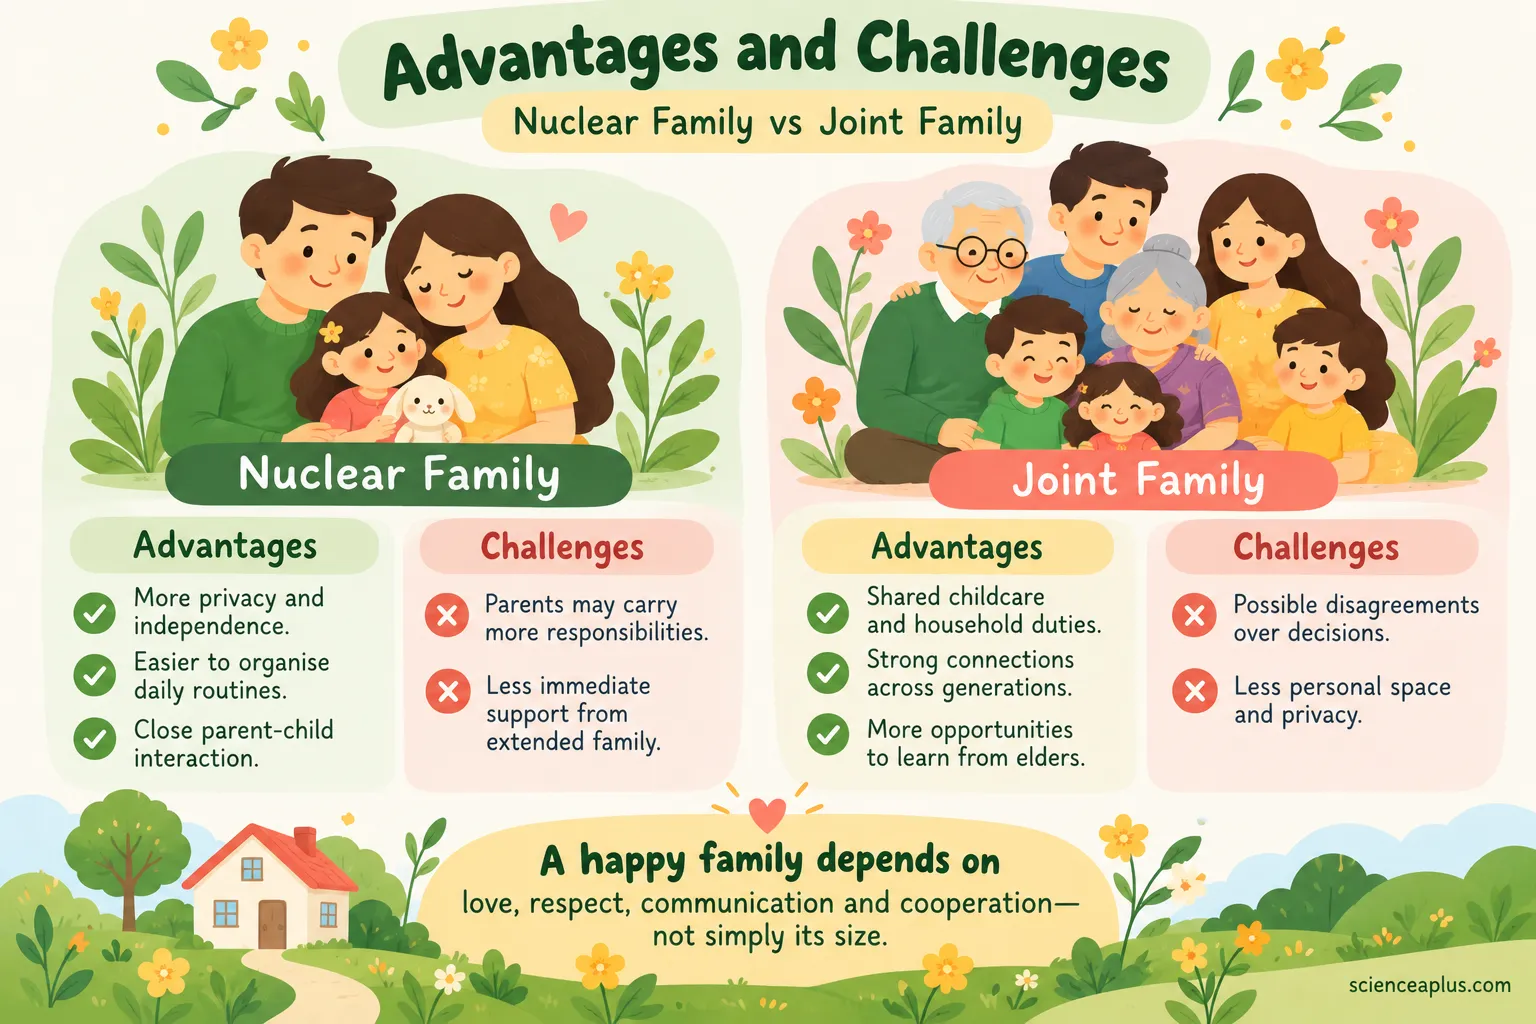
The third slide in the set lists advantages and challenges for both family types. Read the slide as a list of tendencies, not rules. Whether a family finds a feature helpful or difficult depends on the people, the home and the money they have.
Nuclear family: advantages and disadvantages
Nuclear families tend to have more privacy and independence, routines that are easier to organise, and close day-to-day interaction between parents and children.
The challenges are mirror images. Parents may carry more of the responsibilities, such as childcare, housework and earning, and there is less immediate support from extended family if someone is ill, loses a job or needs a break. In the UK, ONS figures show that families with a lone parent made up 16.0% of families in 2025, and for these households the lack of a second adult can be especially noticeable.
Joint family: advantages and disadvantages
Joint families often share childcare and household duties, have strong connections across generations, and offer children more opportunities to learn from elders, whether that is a recipe, a language or a family story.
The challenges include possible disagreements over decisions, since more adults may have a say, and less personal space and privacy. Space is measurable: ONS publishes data on bedroom occupancy for multigenerational households, because overcrowding is a real concern for some families.
The science behind it: what does research say about grandparents and children?
One of the biggest claims about joint families is that children benefit from grandparents. This is a testable idea, and researchers in several fields have tested it. The honest summary is that the evidence is real but mixed.
Evolutionary biology: the grandmother hypothesis
Humans are unusual among apes because women often live for decades after their last child is born. In 1998 the anthropologist Kristen Hawkes and colleagues proposed in the journal PNAS that grandmothers help by finding food and caring for grandchildren, which could help explain long post-menopausal lifespans. The idea is still debated.
Child survival studies
Rebecca Sear and Ruth Mace reviewed 45 studies in 2008 in the journal Evolution and Human Behavior. The presence of a maternal grandmother was linked to better child survival in 9 of 13 studies, and the presence of a paternal grandmother in 9 of 17. Grandfathers showed a much weaker effect. The authors concluded that help from relatives is probably a universal feature of human child-rearing, but that who helps depends on the local environment.
Child development and wellbeing
Studies in richer countries ask a different question: how does grandparent involvement relate to children’s behaviour and wellbeing? A 2009 study in the Journal of Family Psychology surveyed 1,515 English and Welsh pupils aged 11 to 16. Those who reported more involvement from a grandparent had fewer emotional problems and more prosocial behaviour, and the link was stronger for young people in lone-parent and stepfamilies. The study relied on teenagers’ own reports and shows an association, not proof of cause: closer families might simply have closer grandparents too.
A 2019 systematic review in Social Science & Medicine, covering 206 studies, concluded that the evidence on how grandparents influence child health and development is heterogeneous. Studies differ in how they define co-residence, caregiving and outcomes, and the pathways by which grandparents might influence children are limited by the data available. In other words, researchers do not agree on a single answer, and results vary between countries and families.
When you read claims like these, apply the habits from our guide to the scientific method in psychology: ask who was studied, how outcomes were measured, and whether anything else could explain the result.
Inherited traits or learned behaviour?
Families pass things to the next generation in two very different ways. Biology passes on genes, which are sections of DNA inherited from both parents. Culture and daily life pass on learned behaviour: language, recipes, habits, beliefs and skills. A child in a joint family may learn more from grandparents, but family structure does not change the child’s genes.
Genes themselves are inherited in the same way in every family type, as described in our guide to alleles and inheritance. For the basic chemistry of DNA, see genetics definitions: DNA, RNA, mitosis and meiosis.
How much of a trait comes from genes? Scientists use heritability, which estimates how much of the variation between people in a group is explained by genetic differences. A 2015 meta-analysis in Nature Genetics pooled data from 2,748 publications, 17,804 traits and about 14.6 million twin pairs and found an average heritability of 49% across all traits. That average hides huge differences between traits, and it does not mean that 49% of any one person’s traits are “genetic”.
One related point matters for family structure. Because living arrangements are a choice shaped by money, housing, jobs and culture, they are mainly a social and economic feature, not an inherited one. A person born into a joint family is not genetically “a joint-family person”. Similarly, how people behave in a family involves learning: our guide to positive psychology describes what research says about relationships and wellbeing.
Flip cards: test your vocabulary
Ageing populations and the future of family living
One reason family types matter to governments is that populations are getting older. The United Nations’ World Population Prospects 2024 estimated the world’s population at 8.2 billion in 2024, and projected that by the late 2070s the number of people aged 65 and over will exceed the number of children under 18.
The US Census Bureau’s An Aging World report, published in September 2026, estimates that 10.5% of the world’s people were aged 65 or over in 2025, and projects 19.6% by 2060. In Europe the share is projected to rise from 21.0% to 30.8%, and in 2025 Japan had the highest share of any country, at 29.7%.
Older populations raise practical questions about who provides care. Some societies rely mainly on families, others on a mix of pensions, health services, paid carers and family help, and neither system is automatically superior. In 2021, 2.1% of households in England and Wales were multigenerational, and the share of these containing one or more carers fell from 40.3% in 2011 to 35.9% (ONS).
Maths practice: household statistics
Try these questions using figures from this article. Tap a question to reveal a model answer.
The UK had 27.0 million households in 2015 and 29.0 million in 2025. Calculate the percentage increase. (3 marks)
Increase = 29.0 − 27.0 = 2.0 million. Percentage increase = 2.0 ÷ 27.0 × 100 ≈ 7.4%. ONS quotes 7.2% because it uses unrounded figures, so a small difference is expected when you work with rounded data.
The 2011 Census of India counted 248,858,281 households, of which 40,019,580 were joint households. What percentage were joint? (2 marks)
40,019,580 ÷ 248,858,281 × 100 ≈ 16.1%.
In the same census, 129,748,201 households were nuclear and 39,279,937 were supplemented nuclear. What percentage of households were one of these two types? (3 marks)
Total = 129,748,201 + 39,279,937 = 169,028,138. Percentage = 169,028,138 ÷ 248,858,281 × 100 ≈ 67.9%. This shows that changing the definition of the groups changes the answer.
Six homes in a village have 3, 4, 4, 5, 6 and 10 people. Find the mean and median household size and explain why they differ. (4 marks)
Mean = (3 + 4 + 4 + 5 + 6 + 10) ÷ 6 = 32 ÷ 6 ≈ 5.3. Median: the middle two values are 4 and 5, so the median is 4.5. The mean is higher because the one large household of 10 pulls it up.
India’s fertility rate fell from 2.2 (2015–16) to 2.0 (2019–21). Find the percentage decrease and say whether 2.0 is above or below replacement level (2.1). (3 marks)
Decrease = 0.2 ÷ 2.2 × 100 ≈ 9.1%. A rate of 2.0 is below the replacement level of 2.1.
The share of the world aged 65 or over was 10.5% in 2025 and is projected to be 19.6% in 2060. Find the change in percentage points and the percentage change. (3 marks)
Change = 19.6 − 10.5 = 9.1 percentage points. Percentage change = 9.1 ÷ 10.5 × 100 ≈ 86.7%.
Choosing evidence, not sides
Families change as incomes, housing, health and jobs change, and a household may be nuclear at one stage of life and multigenerational at another. A young couple may move in with parents to save money, and an older parent may move in with a child after an illness.
What the evidence does support is that the quality of relationships and access to practical help matter. That could mean grandparents helping with childcare, a neighbour or friend, a nursery, or a flexible workplace. For a related look at how daily social connection supports wellbeing, see our guide to a balanced social life.
Frequently asked questions about nuclear and joint families
What is the difference between a nuclear family and a joint family?
A nuclear family is a household of parents and their children, a couple, or a single parent with children. A joint family is a household where several related people, often from different generations, live together and share responsibilities. Joint families are usually larger and may have less privacy but more shared support.
What are the advantages of a nuclear family?
Nuclear families usually have more privacy and independence, easier day-to-day routines and close parent–child interaction. They can also make decisions and relocate for work or study more quickly. These are tendencies, not guarantees: how well a household works depends on money, health, relationships and available support.
What are the disadvantages of a nuclear family?
Parents may carry more of the childcare, housework and income-earning, and there may be less immediate help from relatives in a crisis. Lone-parent households, which were 16.0% of UK families in 2025, can find this especially hard. Support from friends, neighbours, schools and services can reduce the gap.
What are the advantages of a joint family?
Joint families can share childcare, chores and costs, and give children more contact with older relatives. They may also give older adults company and practical help. Research on grandparent involvement is mixed, though, so these benefits depend on the family and cannot be assumed for every household.
What are the disadvantages of a joint family?
Joint families can have less personal space and privacy, and more people may have a say in decisions, which can cause disagreements. Crowded housing is a practical concern: ONS publishes data on bedroom occupancy in multigenerational households. Many joint families manage these challenges well through communication and clear roles.
Are joint families still common in India?
The 2011 Census of India recorded about 16.1% of households as joint and 52.1% as nuclear. Another 15.8% were “supplemented nuclear”, meaning a nuclear family plus other relatives. No newer census household-type table was found when this article was checked, so these 2011 figures are the latest official breakdown used here.
Why are households getting smaller?
Several long-term changes act together: the demographic transition (fewer births and longer lives), urbanisation, rising incomes, which can make separate homes more affordable, and ageing populations. In the UK, ONS recorded an average of 2.36 people per household in 2025. The causes vary between countries, and surveys alone cannot prove which matters most.
Is a nuclear or joint family better for children?
Research does not show that either type is better for every child. A 2019 systematic review described the evidence on grandparents’ influence as heterogeneous, and a 2009 study of English and Welsh teenagers found associations, not proof of cause. Warmth, low conflict, stable routines and enough resources matter in every family type.
What is an extended family?
An extended family is the wider network of relatives beyond parents and children, such as grandparents, aunts, uncles and cousins. They may live in the same home, nearby or in different countries. When several generations share one home, statisticians call it a multigenerational household. It was 2.1% of households in England and Wales in 2021.
How is average household size calculated?
Divide the number of people living in households by the number of households. For example, 200 people in 40 homes gives 5 people per household. The UN defines it as the average number of usual residents per household. Different surveys may count students, visitors or people in institutions differently, which can change the result.