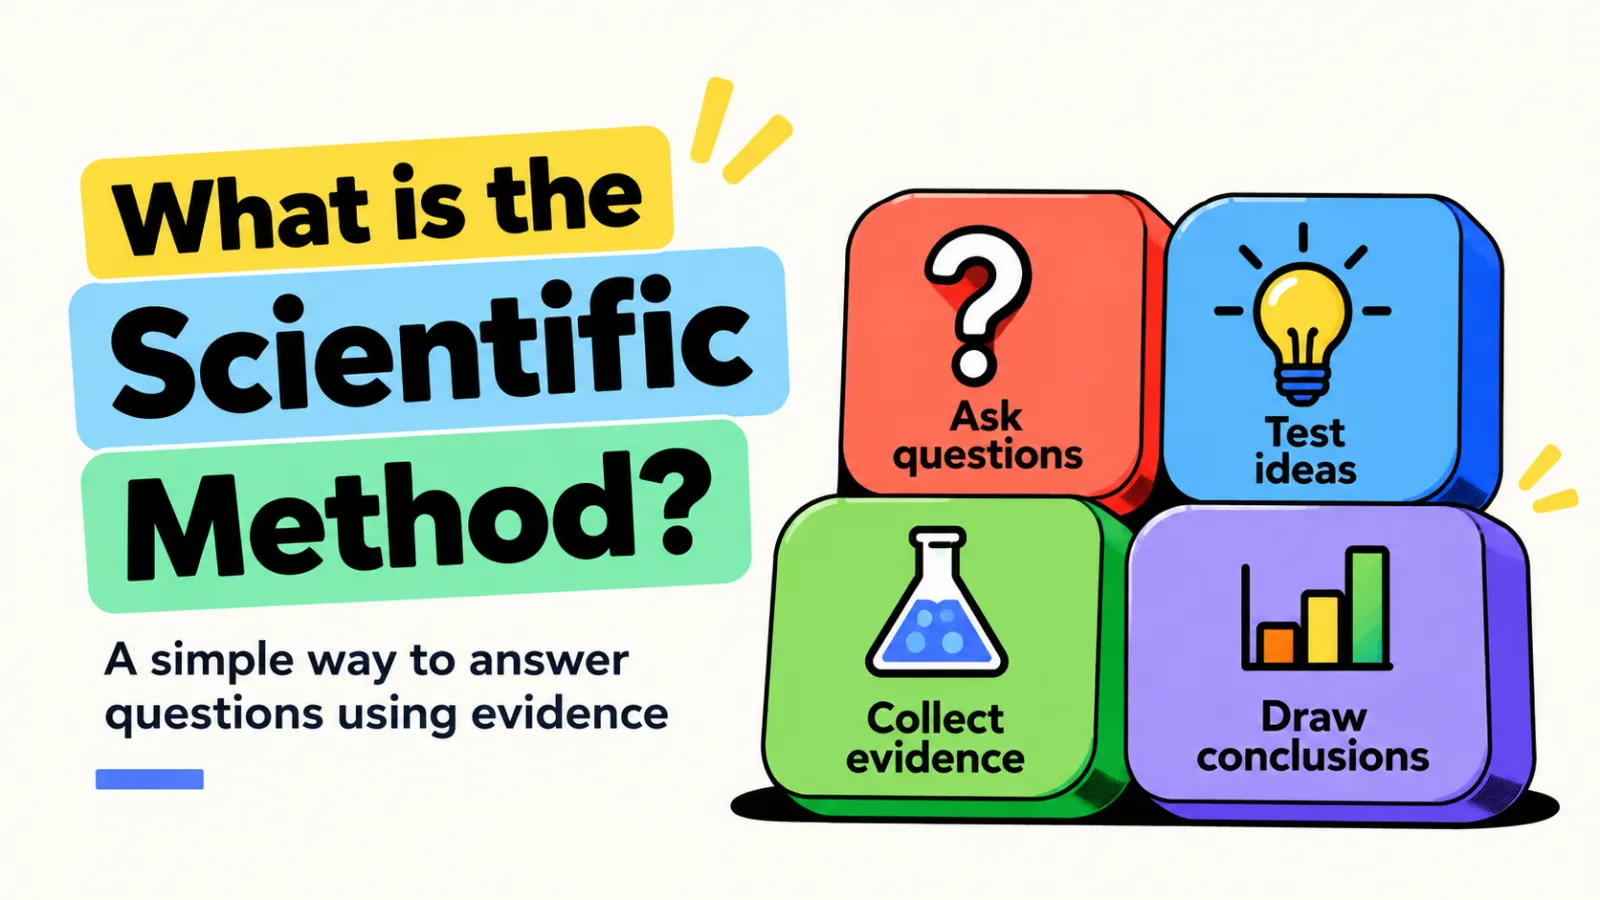
The scientific method is a way of answering questions by testing ideas against evidence instead of guessing. In school science it is usually taught as six steps: ask a question, do some research, make a hypothesis, test it with a fair experiment, analyse the results, then draw a conclusion and improve. This guide shows how to use the scientific method step by step, with worked examples you can try at KS3 and GCSE level.
Whether you are growing seedlings, timing how fast sugar dissolves or wondering why your phone battery dies faster in the cold, the same habits apply. Observe carefully, change one thing at a time, measure honestly, and let the data decide. If you want the short version first, our quick guide to the scientific method made easy covers the basics in a few minutes. This article goes further, with worked examples, common mistakes and the history behind the method.
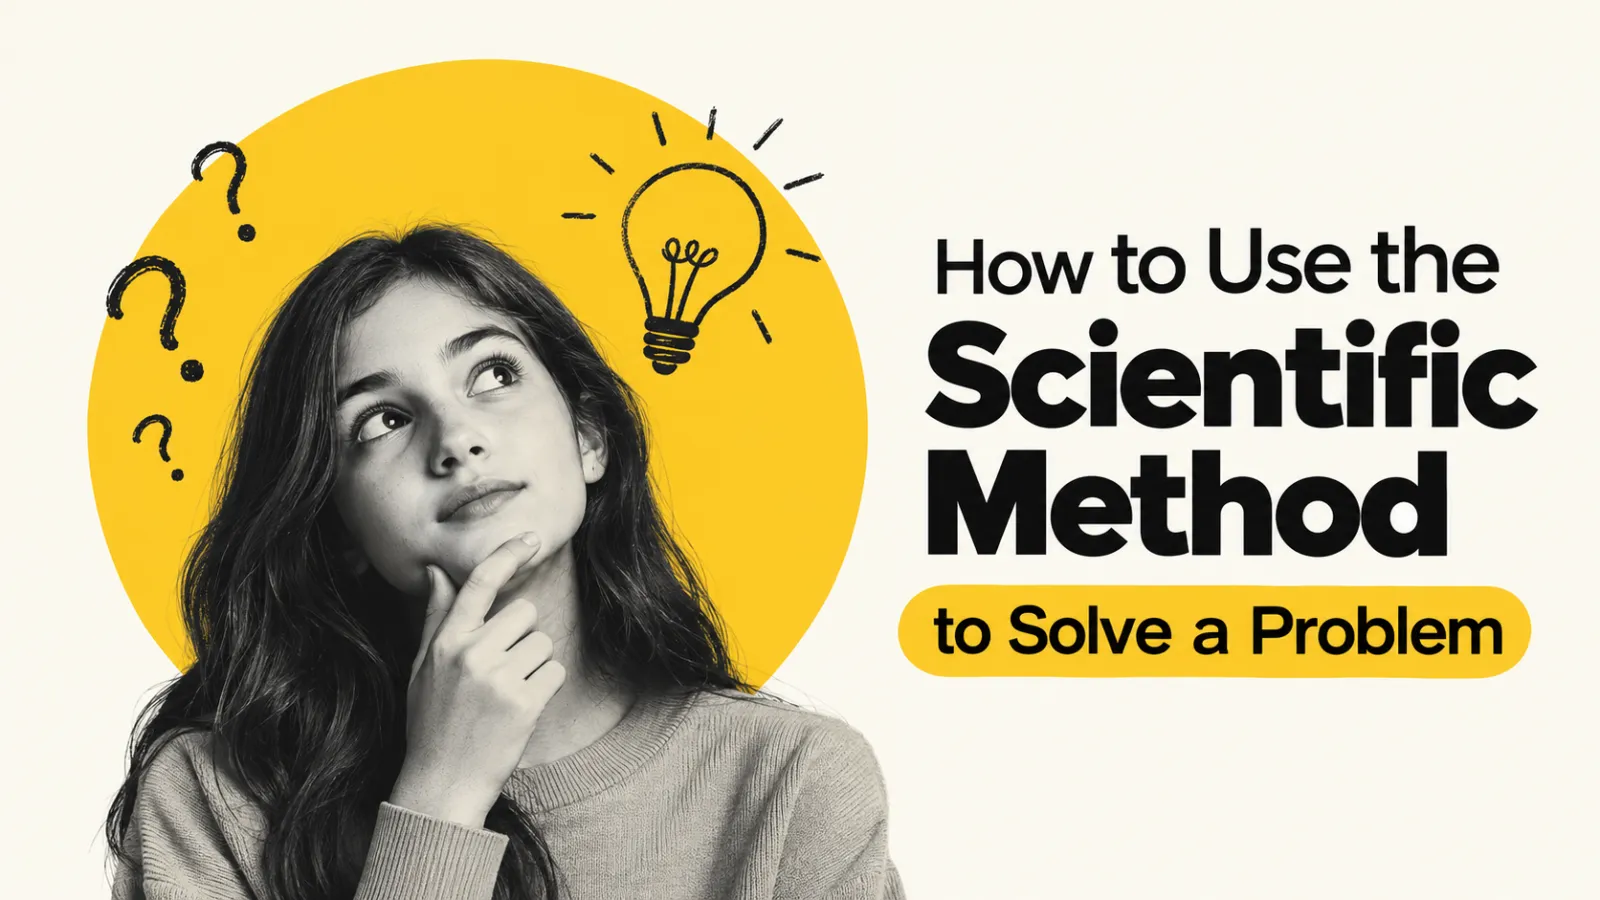
The scientific method at a glance
Here is the whole process on one page. Each step has its own section below, and the infographics from our series show the same six steps in a visual form.
| Step | What you do | Example: does light affect plant growth? |
|---|---|---|
| 1. Ask a question | Observe something and turn it into a testable question | Do seedlings by a window grow differently from seedlings in a cupboard? |
| 2. Do some research | Find out what is already known from reliable sources | Plants use light for photosynthesis to make food |
| 3. Make a hypothesis | Write a testable explanation and a prediction | If seedlings get more light, they will grow taller because they can photosynthesise more |
| 4. Test it | Run a fair test and collect data | Grow identical seedlings in different light levels and measure height every two days |
| 5. Analyse the results | Use tables, graphs and averages to find patterns | Calculate the mean height for each light level |
| 6. Conclude and improve | Decide what the evidence shows and plan what to do next | Seedlings in more light were taller. Next, test other factors |
Step 1: Ask a question (start with an observation)
Every investigation begins with noticing something. You see that one patch of the garden has taller grass, that ice melts faster on a metal tray than on a wooden one, or that your bike tyre goes flat more slowly in summer. An observation is something you can see, hear, measure or count.
The next job is to turn that observation into a testable question. A testable question is one you can answer by collecting data. Compare these pairs:
- Weak: Why do plants like sunlight? (too vague, and "like" cannot be measured)
- Better: How does the amount of light affect the height of tomato seedlings after two weeks?
- Weak: Is cold water nicer? (an opinion, not a measurement)
- Better: How does water temperature affect the time taken for a sugar cube to dissolve?
A good question names two things: what you will change and what you will measure. If you cannot say what you would measure, the question is not ready yet.
Check your question with three prompts
- Can I measure it? Think of a number, a count, a time or a clear category.
- Can I change one thing? If three things must change at once, split the question into smaller ones.
- Is it safe and practical? You need the equipment and time, and your teacher or a responsible adult must agree it is safe. Never test anything that could harm you or others.
Step 2: Do some research
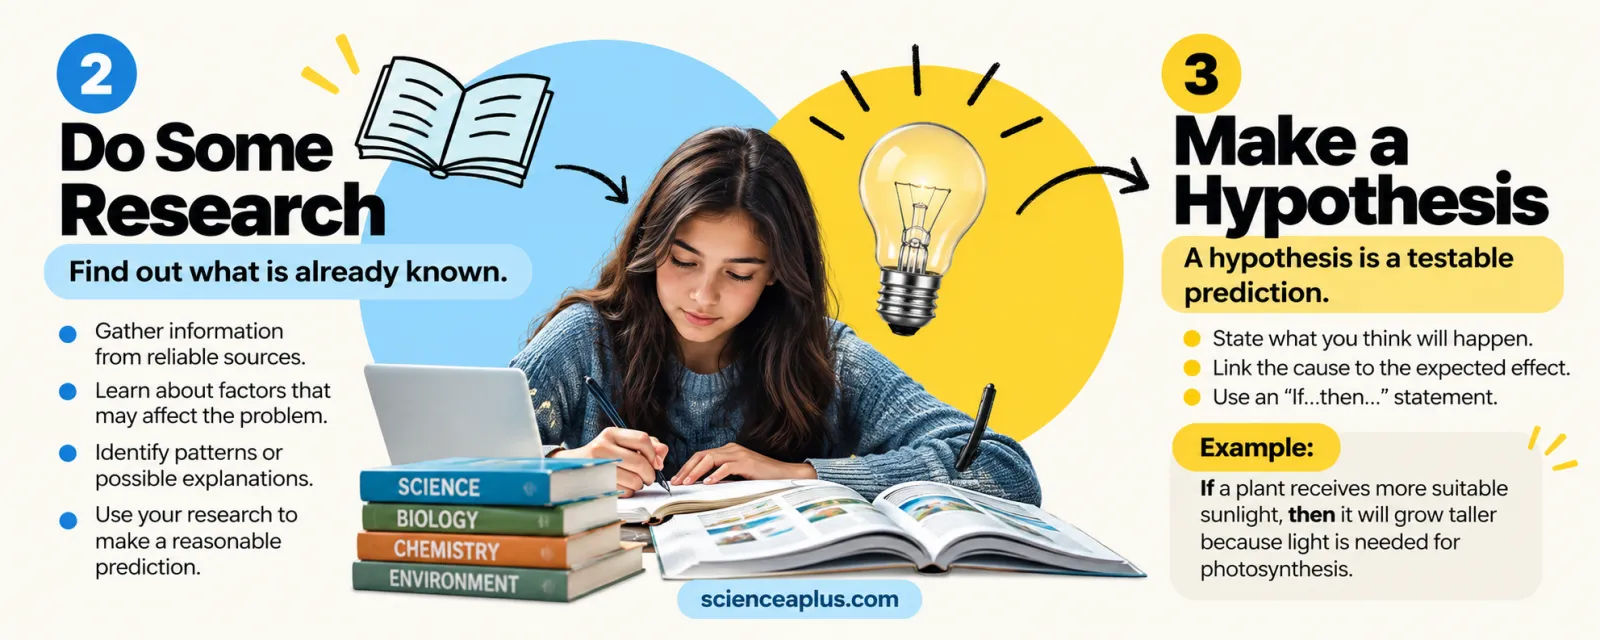
Before you build anything, find out what is already known. Someone has almost certainly asked a similar question, and their work can save you days of effort and help you predict what will happen.
Good research means using reliable sources: textbooks, exam board specifications, museums, universities, the NHS, NASA and similar organisations. Be careful with anonymous websites and social media posts, which often repeat myths. Our guide to what pseudoscience is explains how to spot claims that look scientific but are not.
While researching, look for three things:
- Factors that may affect the result. For plant growth these include light, water, temperature, soil and the type of seed. Each one is a possible variable.
- Patterns and possible explanations. For example, plants make glucose by photosynthesis, which needs light, carbon dioxide and water.
- Methods and measurements. What equipment did others use, and what units? If you need a reminder about converting between centimetres, millimetres and metres, see our unit conversion guide.
Research also protects you from a classic trap. If you already know that a strong effect exists, you can design a test that is sensitive enough to detect it. If you find that the question has been answered thoroughly, you can refine it into something new, such as testing a different type of plant or a different temperature range.
Keep a lab notebook from the start
Write down your question, your sources and your plan before you begin. Date every entry. Record measurements straight away, with units, rather than trying to remember them later. Scientists do this because memory is unreliable and a clear record lets someone else check your work or repeat it.
Our post on lab basics and simple experiments covers the equipment and safety rules you will meet in a school laboratory, and simple experiments to do at home has ideas for safe projects.
Step 3: Make a hypothesis and a prediction
A hypothesis is a testable explanation for what you have observed. It says what you think is happening and why. Good hypotheses are specific, they link a cause to an effect, and they can be shown to be wrong. That last point matters: if no result could ever contradict your idea, it is not a scientific hypothesis.
The infographic above suggests an "If… then… because…" sentence, and it works well in school science:
If [change this], then [this will happen], because [scientific reason].
For our seedling example: If seedlings receive more light, then they will grow taller, because light is needed for photosynthesis and the plant can make more food to grow.
Hypothesis versus prediction
Many students use these two words as if they mean the same thing. At GCSE it helps to separate them.
- The hypothesis is the explanation: "Warmer water makes particles move faster, so more collisions happen with the sugar and it dissolves more quickly."
- The prediction is what you expect to measure if the hypothesis is right: "A sugar cube will dissolve in less time in water at 60 °C than in water at 20 °C."
Some teachers use the word hypothesis for both, so check which your exam board and teacher expect. Either way, always include the reason after the word "because". It shows you are using scientific ideas rather than guessing.
Step 4: Test it with a fair experiment
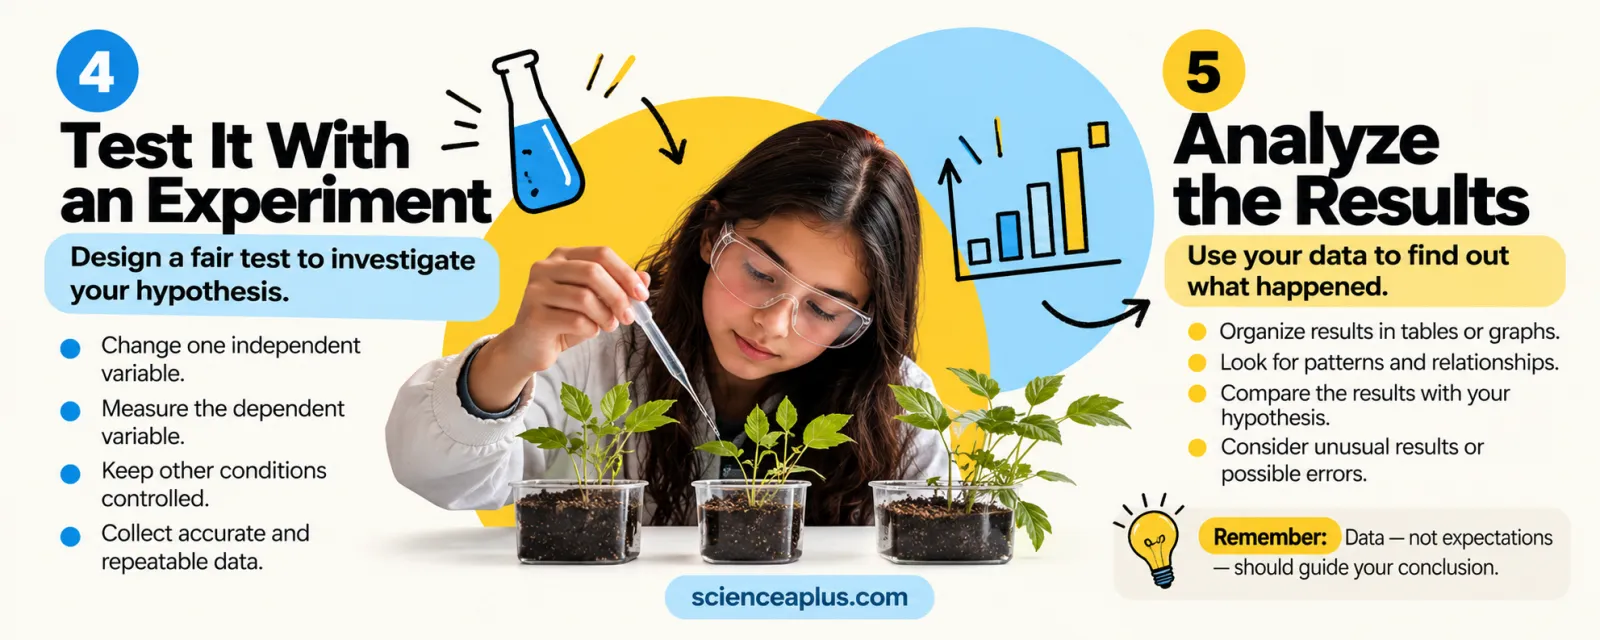
This is the heart of the scientific method. A fair test changes only one factor, measures one outcome and keeps everything else the same. If you change more than one thing, you cannot tell which change caused the result.
The three kinds of variable
| Variable | Meaning | Seedlings example | Sugar example |
|---|---|---|---|
| Independent | The one thing you deliberately change | Amount of light (window or dark cupboard) | Water temperature |
| Dependent | The thing you measure | Height of each seedling in cm | Time for the sugar cube to dissolve in seconds |
| Control | Everything you keep the same | Type of seed, pot size, compost, volume of water, room temperature | Mass of sugar, volume of water, stirring, size of cup |
A simple way to remember them: the independent variable is the one you change, and the dependent variable depends on it. On a graph, the independent variable goes on the x-axis and the dependent variable on the y-axis.
Worked example 1: does temperature affect how fast sugar dissolves?
- Question: How does water temperature affect the time taken for a sugar cube to dissolve?
- Hypothesis: If the water is warmer, the sugar will dissolve faster, because particles move faster at higher temperatures and collide more often with the sugar.
- Independent variable: water temperature (20 °C, 40 °C, 60 °C).
- Dependent variable: time to dissolve completely, in seconds.
- Control variables: 100 cm³ of water, one cube of the same size, the same type of cup, the same gentle stirring.
- Method: Heat water to each temperature, drop in a cube, start the timer, stop when no sugar can be seen, then repeat three times for each temperature.
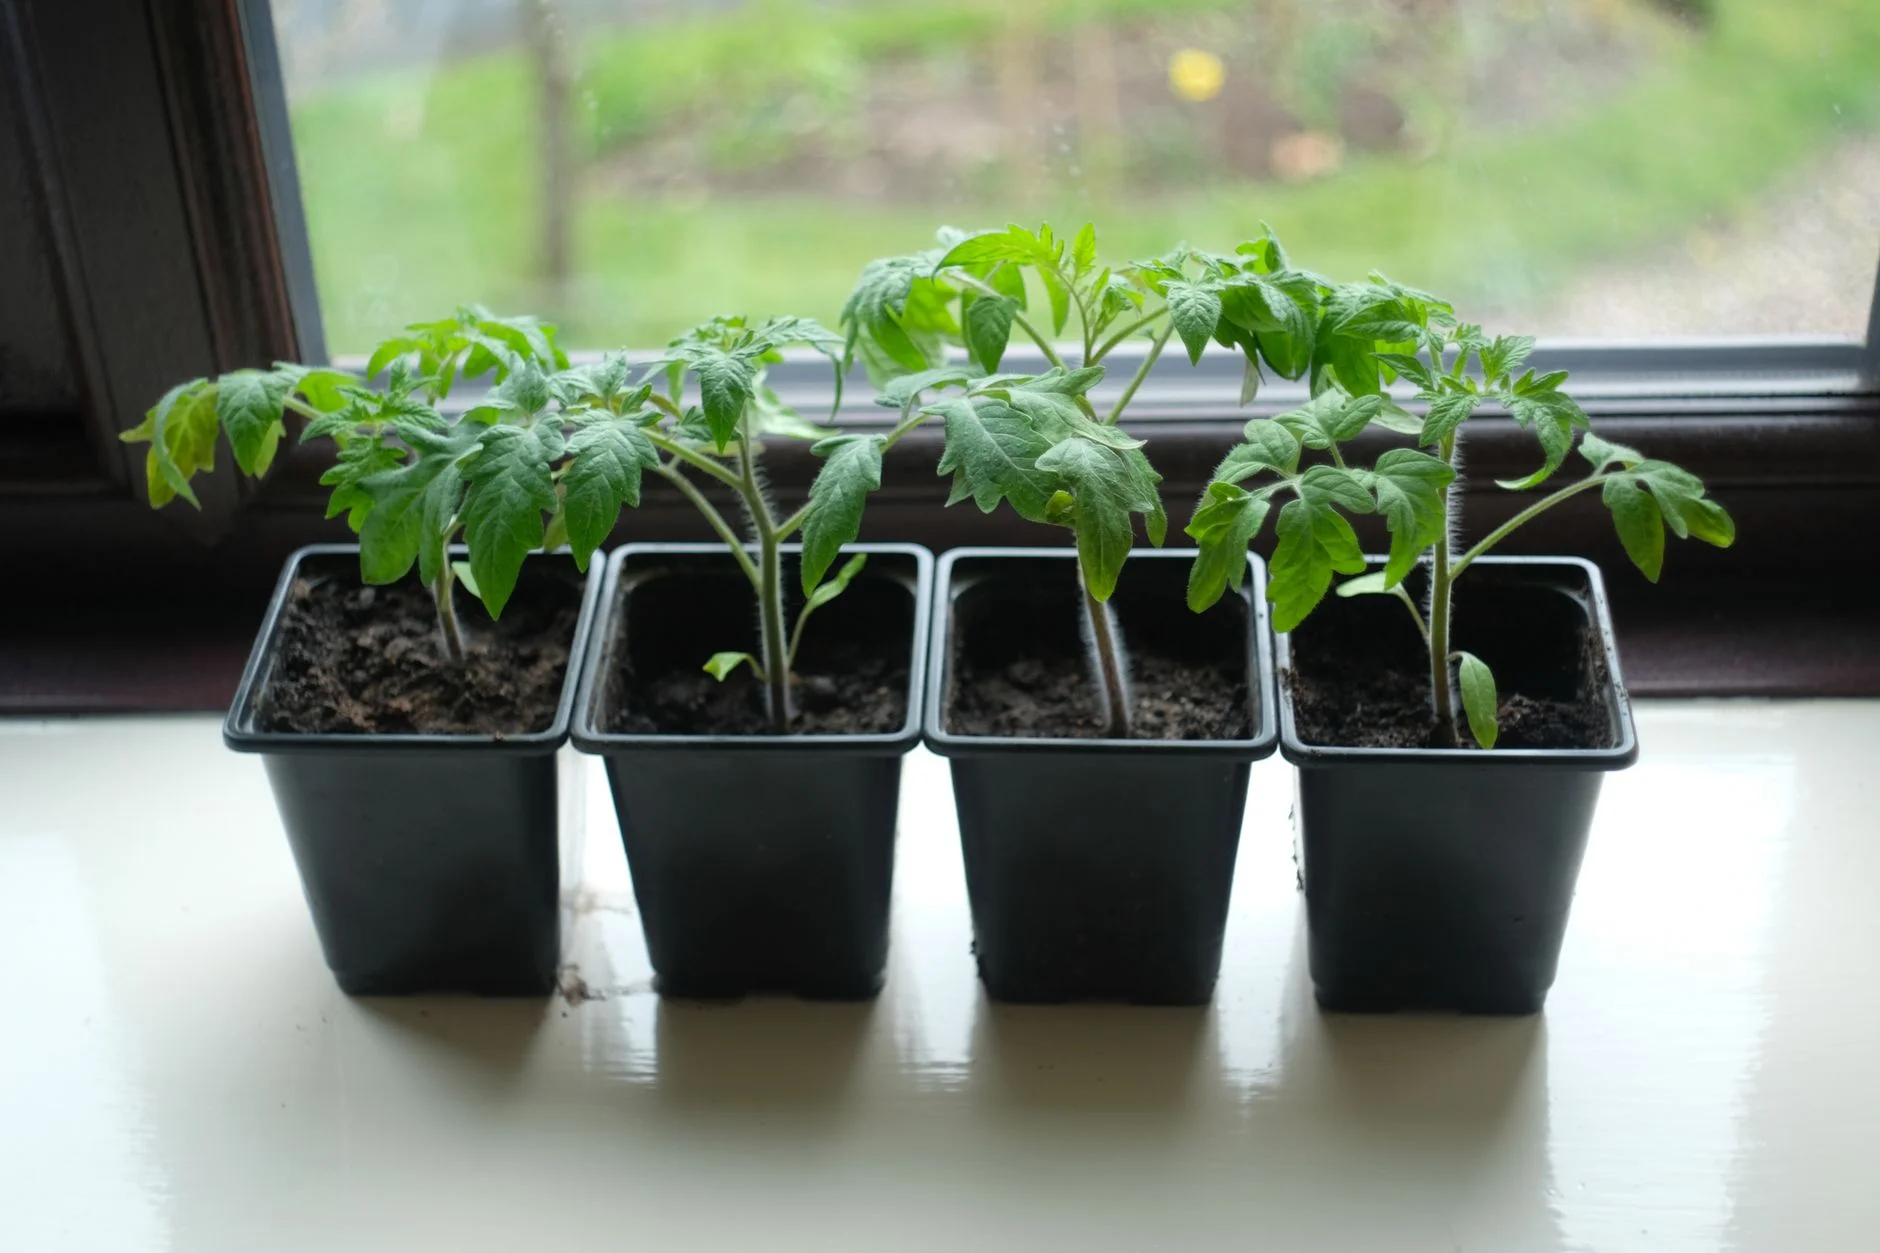
Worked example 2: does light affect plant growth?
Here the independent variable is light, but notice how many things could spoil the fairness. A seedling in a dark cupboard is also probably cooler and gets watered less often if you forget about it. To keep it fair, give every seedling the same compost, the same amount of water at the same time, and place them where the temperature is similar. Use several seedlings per condition, because one plant might simply be unusual.
Why you repeat measurements
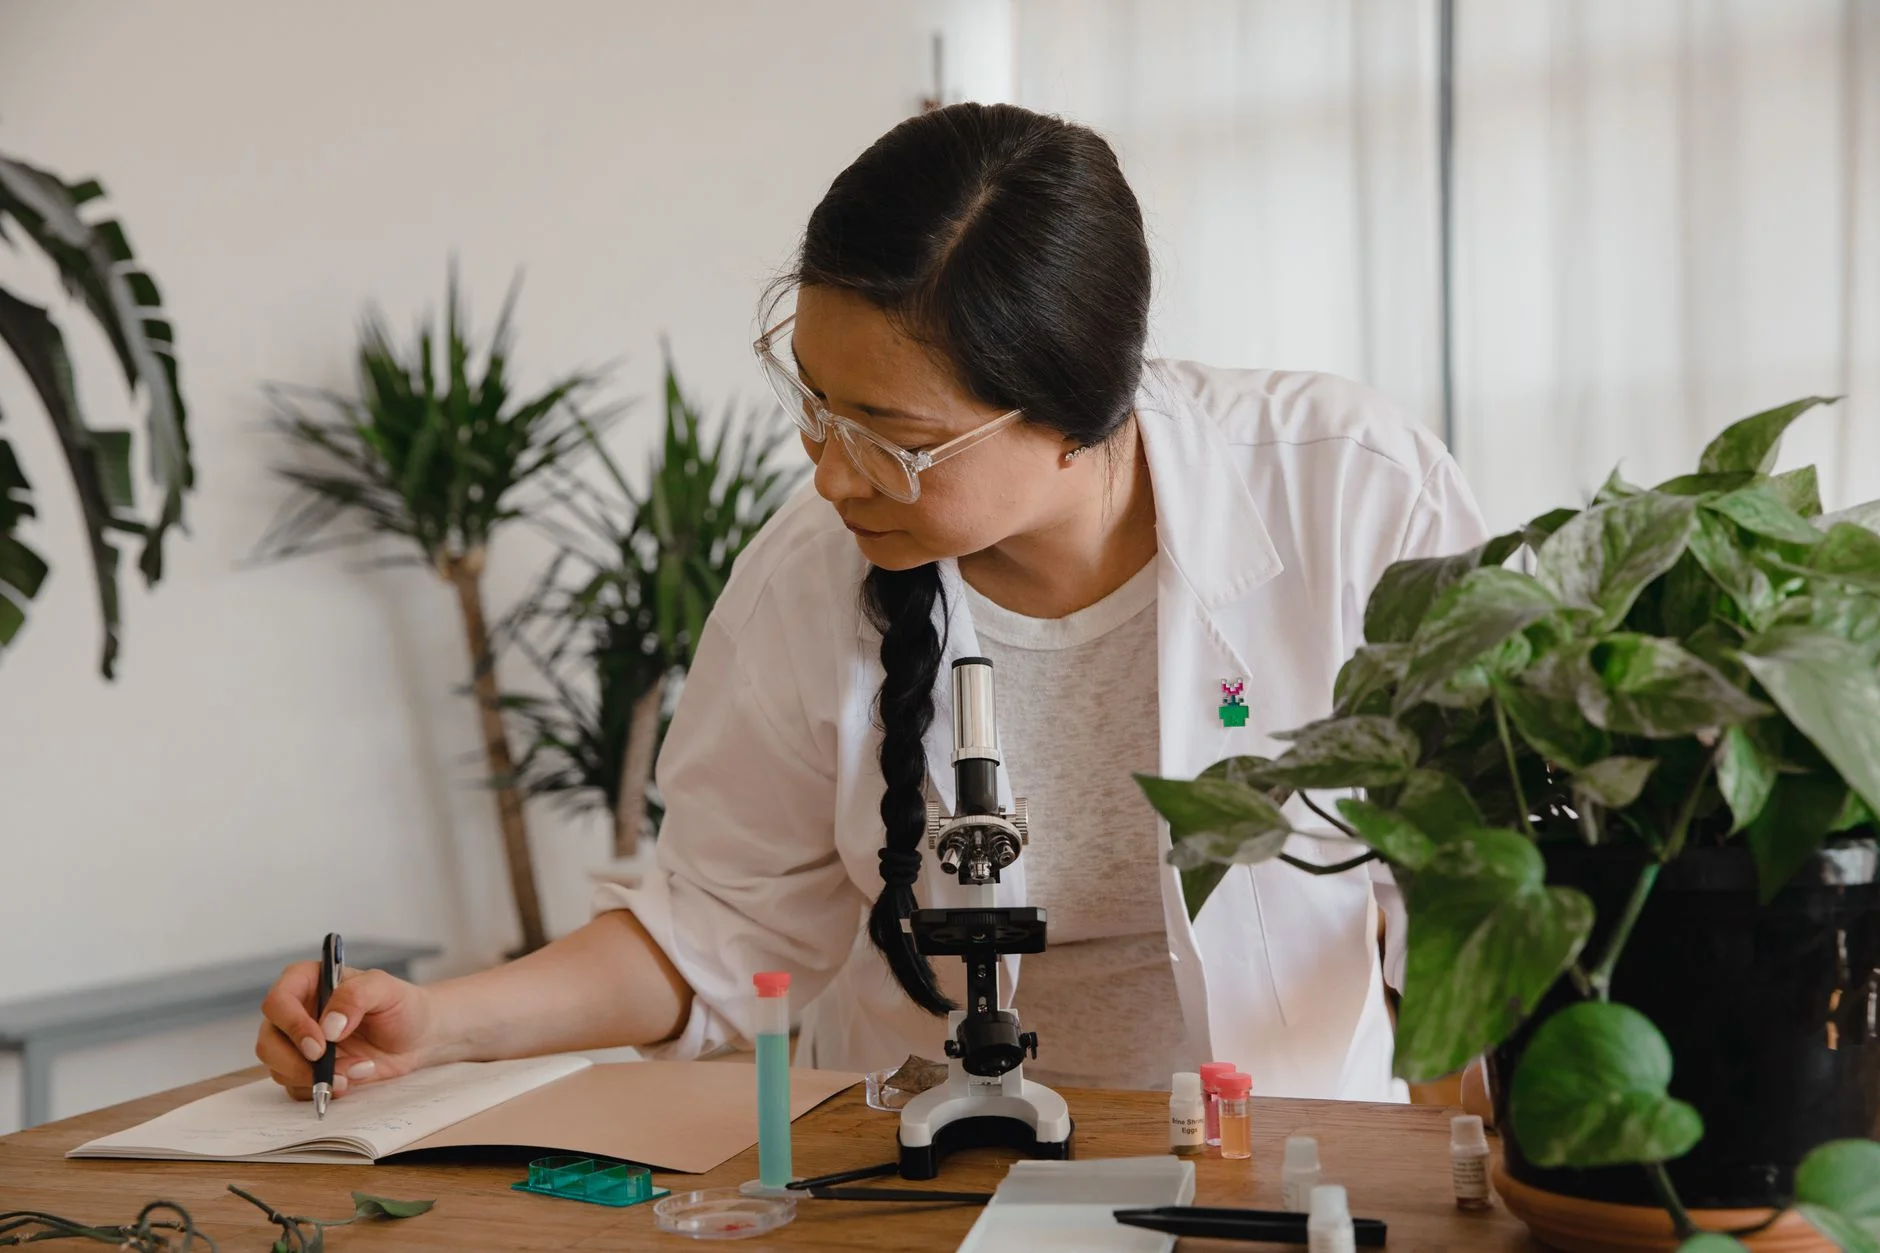
Every measurement has some error. Your reading of the timer, the exact temperature of the water and tiny differences between sugar cubes all add small variations. Repeating the test lets you spot a result that does not fit and calculate a mean. Three repeats is a sensible minimum in school; more is better.
These words appear in GCSE questions, and examiners expect you to use them precisely:
- Repeatable: if the same person repeats the experiment with the same method and equipment, they get similar results.
- Reproducible: if a different person, or a different method or piece of equipment, gives similar results.
- Valid: the experiment measures only what it claims to, with all other variables controlled.
Choosing equipment and recording data
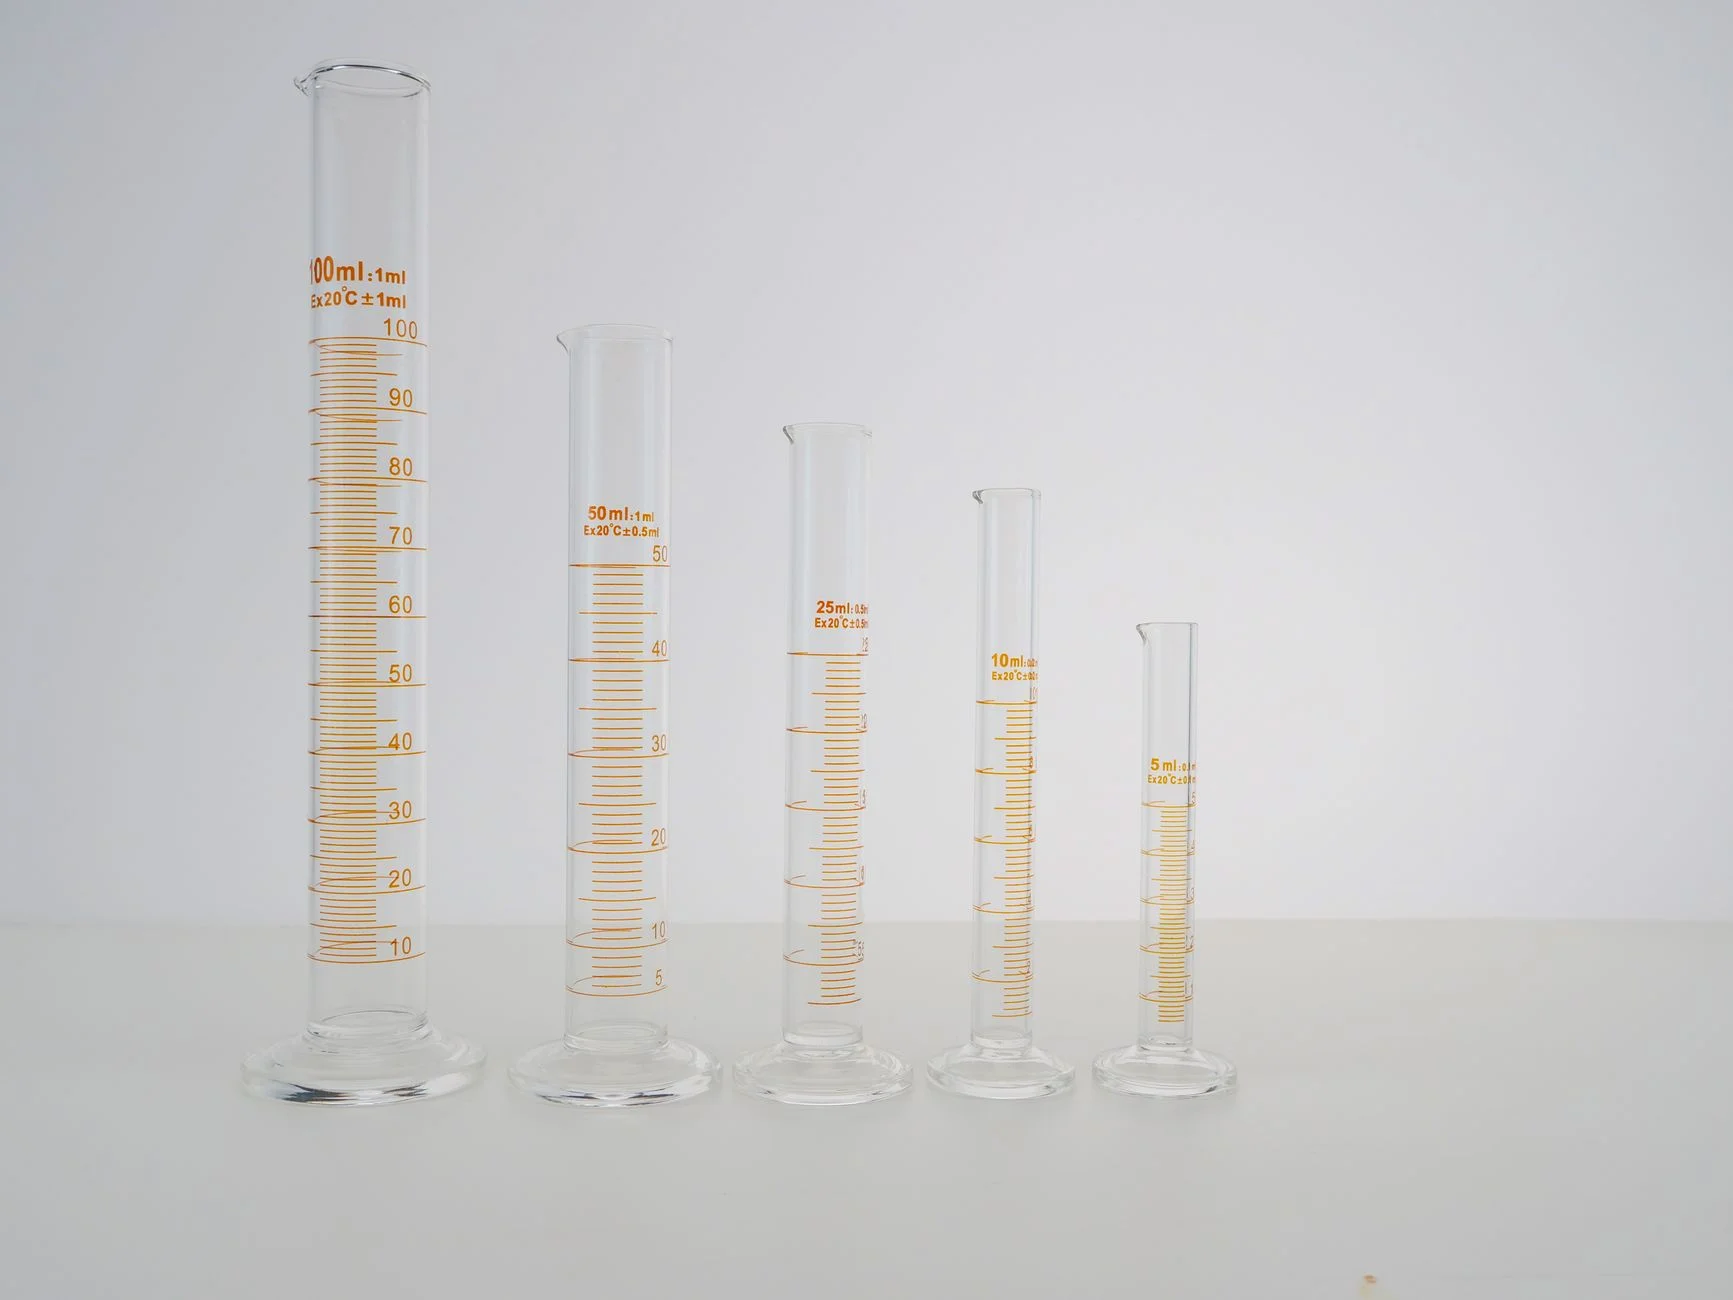
Pick equipment that is precise enough for your measurements. A ruler marked in millimetres suits seedlings; a stopwatch that reads to 0.1 s suits dissolving times. Draw a results table before you start, with headings that include units, such as "Time to dissolve (s)". A blank table with room for three repeats keeps you organised and stops you losing readings.
Your fair-test checklist
Tick each item before you start. Your ticks are saved in your browser.
- I have written one testable question
- I know my independent variable and how I will change it
- I know my dependent variable, the units and the equipment
- I have listed at least three control variables
- I have planned at least three repeats for each condition
- I have drawn a results table with units in the headings
- My teacher has checked the safety of my plan
A student tests whether fertiliser affects bean height, but gives the fertilised beans more water too. What is wrong? (2 marks)
Water is a second variable that has changed, so the test is not fair: any difference in height could be caused by the extra water, the fertiliser or both. Water should be a control variable, kept the same for every plant.
Name the independent, dependent and one control variable when testing how the length of a pendulum affects the time of one swing. (3 marks)
Independent: length of the string. Dependent: time for one swing (or time for a number of swings divided by that number). Control: any one of the mass of the bob, the angle it is released from, or the same stopwatch and person timing.
Our guide to the scientific method uncovered adds more detail on how scientists plan experiments, and the next section shows what to do with the numbers once you have them.
Step 5: Analyse the results
Once the data are in, you can see what happened. Analysis means organising the numbers, looking for patterns and comparing them with your prediction. Remember the advice from our infographic: data, not expectations, should guide your conclusion.
Start with a table and a mean
Here are some made-up results for the sugar experiment, to show the method. They are not real measurements.
| Water temperature (°C) | Repeat 1 (s) | Repeat 2 (s) | Repeat 3 (s) | Mean (s) |
|---|---|---|---|---|
| 20 | 118 | 124 | 121 | 121 |
| 40 | 62 | 58 | 60 | 60 |
| 60 | 31 | 29 | 30 | 30 |
The mean is the total of the readings divided by how many there are. For 20 °C: (118 + 124 + 121) ÷ 3 = 363 ÷ 3 = 121 s. The range, the biggest reading minus the smallest, is 124 − 118 = 6 s. A small range means the repeats agree well. Try the calculator below with your own readings.
Graphs show patterns at a glance
Plot the independent variable on the x-axis and the mean of the dependent variable on the y-axis. Label both axes with units. If your independent variable is a number, such as temperature, use a line graph or scatter graph with a line of best fit. If it is a category, such as "window" or "cupboard", use a bar chart.
In the made-up sugar data, the time roughly halves each time the temperature goes up by 20 °C. That is a clear pattern, and it matches the prediction. Look for the shape: a straight line, a curve, or a plateau where the effect levels off.
Deal with anomalies honestly
An anomalous result is one that does not fit the pattern. Suppose a repeat at 40 °C gave 95 s instead of about 60 s. Do not simply delete it because it is inconvenient. Ask why it happened. Perhaps the cube was bigger, or the timer was started late. If you can find a reason, you can explain the anomaly and leave it out of the mean, saying so in your report. If you cannot, repeat the measurement.
Correlation is not causation
Two things can rise and fall together without one causing the other. Ice cream sales and sunburn cases both go up in hot weather, but ice cream does not cause sunburn: sunshine causes both. A fair experiment, where you change one variable and control the rest, is the best way to show cause and effect. This is why simply collecting data from observation can suggest an idea but often cannot prove it.
Step 6: Draw a conclusion and improve
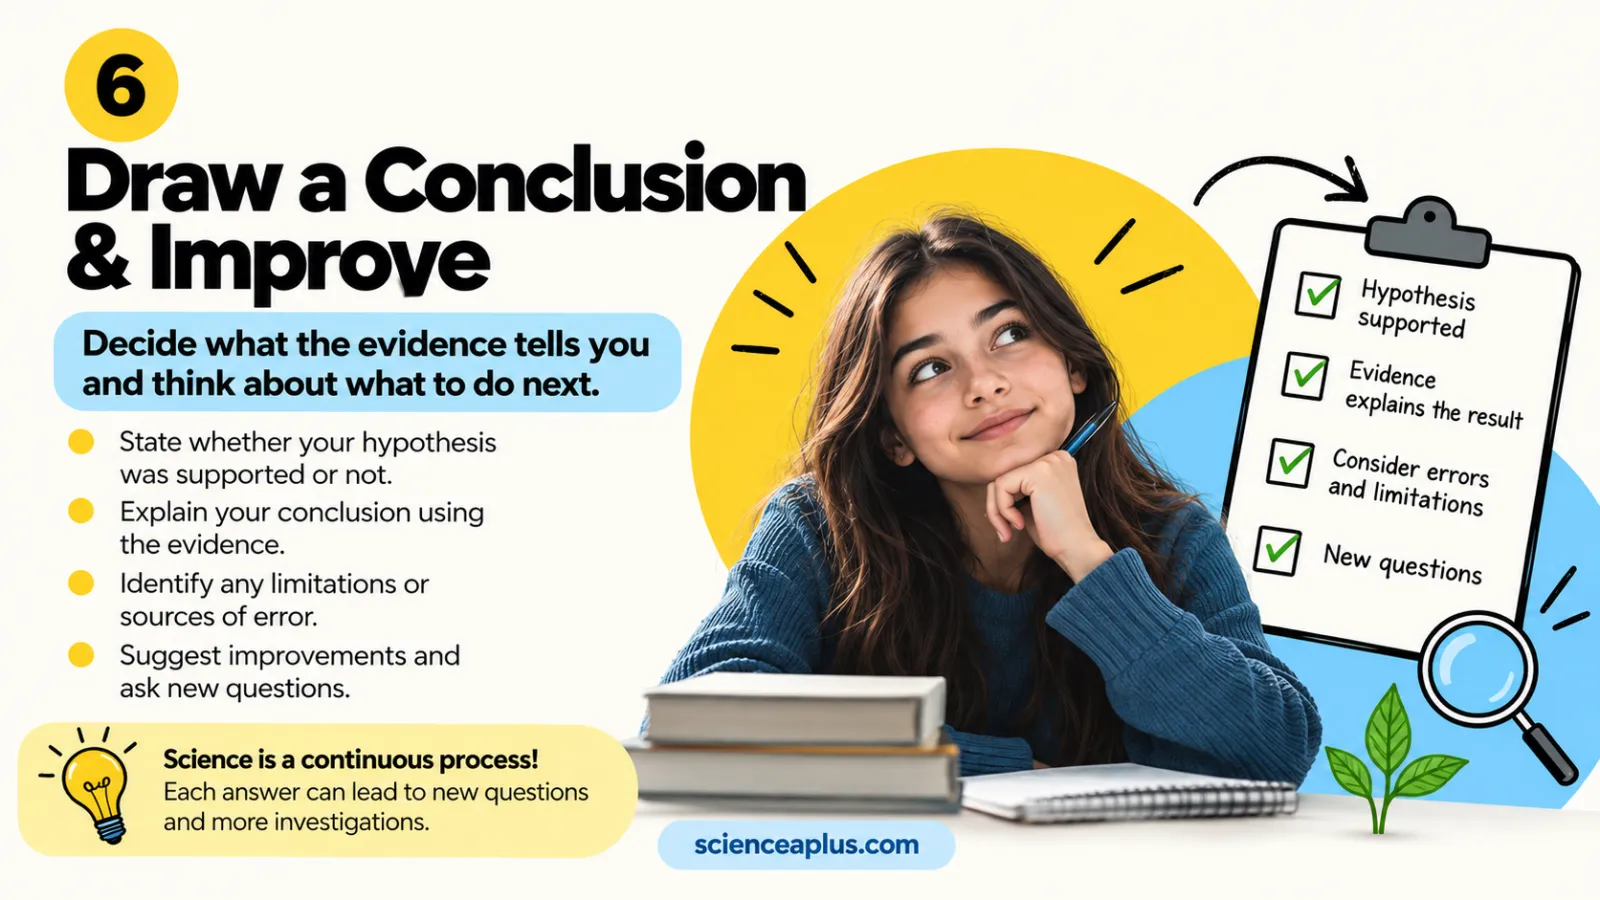
A conclusion answers the question you asked in step 1, using your evidence. The final infographic gives four jobs to do:
- State whether your hypothesis was supported or not.
- Explain your conclusion using the evidence, quoting numbers.
- Identify limitations or sources of error.
- Suggest improvements and ask new questions.
A model conclusion
Using the made-up data: The results support the hypothesis. The mean time to dissolve fell from 121 s at 20 °C to 60 s at 40 °C and 30 s at 60 °C, so warmer water dissolved sugar faster. This fits the idea that particles move faster when heated and collide with the sugar more often. The small range within each temperature suggests the repeats were consistent. A limitation is that the water cooled slightly while the sugar dissolved. Next time I would use an insulated cup and test more temperatures between 20 °C and 60 °C.
Notice the wording. Good scientists say the evidence supports a hypothesis, rather than saying it is proved. A different experiment tomorrow could always add new information. Words such as "suggests", "is consistent with" and "supports" are honest and precise.
Beyond your experiment: sharing, peer review and iteration
Communicate your findings
Science does not end with a result in your notebook. Professional scientists write up their methods, data and conclusions so that others can read, question and repeat them. In school, this might be a lab report, a poster or a short talk. The aim is the same: be clear enough that someone else could repeat what you did.
Peer review
Before research is published in most scientific journals, other experts in the same field read it and check the methods, the data and whether the conclusions follow from the evidence. This is called peer review. Reviewers may ask for more data, point out a flaw or suggest a clearer explanation. It is not a guarantee that a paper is right, but it catches many mistakes, and the work can still be challenged after publication.
You can practise this in class. Swap your plan with a partner and ask three questions: Is the test fair? Could someone else repeat it from the instructions? Do the conclusions match the results?
Iteration: the loop that makes science work
The last step in the infographic says: "Science is a continuous process! Each answer can lead to new questions and more investigations." That is iteration. After your conclusion, you improve the method, change the question or move on to a related one. In the seedling example, you might next test red light and blue light, or different amounts of water.
Replication matters too. If other scientists repeat an experiment and get the same result, confidence grows. If they cannot, that is important information. Fields that study people face particular challenges here, as our post on the scientific method in psychology explains.
A group's results at 60 °C were 30 s, 29 s and 55 s. What should they do about the 55 s reading? (2 marks)
Treat 55 s as a possible anomaly: look for a reason (for example a late stopwatch start or a bigger cube), then repeat the measurement. If they can justify leaving it out, they should say so when they calculate the mean; they should not just delete it without comment.
Why is "my hypothesis was supported" a safer phrase than "my hypothesis was proved"? (1 mark)
Because new evidence from a different experiment could still change the conclusion. Experiments give evidence for or against a hypothesis; they rarely give absolute proof.
A short history of the scientific method
Nobody invented the scientific method in a single moment. It grew over many centuries as thinkers in different places learned that careful testing beats argument alone. Here are some of the key stages.
Ibn al-Haytham (Alhazen), around 1000 CE
Ibn al-Haytham was born around 965 in Basra, in present-day Iraq, and died around 1040 in Cairo. He wrote the Book of Optics between 1011 and 1021. In it he combined mathematics with experiments on light and vision, varying the conditions of his tests to check his ideas. Some historians call him an early pioneer of experimental science, although others warn against crediting any one person as the "father" of the method, because he built on earlier Greek and Islamic scholars.
Francis Bacon, 1620
The English philosopher Francis Bacon published Novum Organum in 1620. He argued that knowledge should be built up from careful observation and experiment, rather than relying only on ancient authorities. His emphasis on collecting evidence and testing ideas helped shape the way science was organised in the 1600s.
Galileo and the telescope
Galileo Galilei used experiments and mathematics to study motion, and used the newly invented telescope to observe the sky in the early 1600s. His work showed how observation and measurement could challenge accepted ideas. He also used experiments, such as rolling balls down slopes, to study motion.
Redi's jars, 1668
For centuries many people believed maggots appeared spontaneously from rotting meat. In 1668 the Italian physician Francesco Redi tested this by putting meat in three jars: one open, one covered with gauze and one sealed. Maggots appeared only where flies could reach the meat. It is a classic example of a controlled experiment with a clear comparison.
James Lind and scurvy, 1747
On 20 May 1747, the naval surgeon James Lind took twelve sailors with scurvy on HMS Salisbury and split them into six pairs. Each pair got the same food plus a different remedy, including cider, vinegar, seawater and oranges with lemon. The sailors who received citrus fruit improved the most, though the fruit ran out after six days. Lind's trial is widely described as one of the first controlled clinical experiments.
Ignaz Semmelweis, 1847
In 1847 the doctor Ignaz Semmelweis introduced handwashing with chlorinated lime in a maternity clinic at Vienna General Hospital. Deaths from childbed fever fell from about 18% in April 1847 to about 2% by June. His evidence was strong, but colleagues largely rejected it at the time because germ theory had not yet been accepted. It shows that good data can be ignored when it clashes with the ideas of the day.
Karl Popper and falsifiability
In the 20th century, the philosopher Karl Popper argued that a scientific theory must be testable and open to being shown wrong. This idea of falsifiability is why a good hypothesis has to make a prediction that could fail. It is also a useful test for spotting pseudoscience.
The Royal Society's Philosophical Transactions, first published in 1665, is often described as the world's oldest continuously published scientific journal. It is an early example of scientists sharing results for others to examine.
Common mistakes when using the scientific method
- Changing more than one variable. If you change the light and the water, you cannot tell which mattered.
- Too few repeats. One reading could be a fluke. Repeat at least three times.
- A vague question or hypothesis. "Does temperature matter?" is hard to test. "Does water temperature affect dissolving time?" is clear.
- Forgetting units. A result of "60" means nothing without "seconds", "cm" or "°C".
- Bending the result to fit. Changing data or ignoring awkward readings to support the hypothesis ruins the experiment. Report what you found.
- Confusing correlation with cause. Only a fair test can show that one thing causes another.
- Drawing conclusions the data cannot support. Three seedlings in one classroom do not prove a rule for all plants.
- Ignoring safety. A risk assessment comes before the practical, not after.
Using the scientific method outside the lab
The method is useful for everyday problems too. If your phone battery drains quickly, you could change one setting at a time and measure how long it lasts. If you want to revise better, you could compare two study techniques over two weeks of quiz scores, keeping the topics and time the same. The thinking is identical: question, evidence, fair comparison, honest conclusion.
Flip card revision
Frequently asked questions about the scientific method
What are the steps of the scientific method?
The common school version has six steps: ask a question, do background research, make a hypothesis, test it with a fair experiment, analyse the results, and draw a conclusion and improve. Some lists add "observe" at the start or "communicate" at the end. Real scientists often move back and forth between steps.
What is a hypothesis in simple terms?
A hypothesis is a testable explanation for something you have observed. It usually says how one thing affects another and why, for example "If water is warmer, sugar dissolves faster because particles move faster." A good hypothesis can be tested and could be shown to be wrong.
What is the difference between a hypothesis and a prediction?
The hypothesis is the explanation, including the reason. The prediction is the specific result you expect to measure if the hypothesis is right, such as "the sugar cube will dissolve in under 60 seconds at 60 °C." Some teachers use the words interchangeably, so check what your exam board expects.
What are independent, dependent and control variables?
The independent variable is the one thing you deliberately change. The dependent variable is what you measure to see the effect. Control variables are all the other factors you keep the same so the test is fair. In a plant experiment, light might be independent, height dependent, and water and soil controlled.
Why is a fair test important?
A fair test changes only one variable at a time. If two things change together, you cannot know which one caused the result, so your conclusion would be unreliable. Controlling the other variables and repeating the measurements makes the evidence more trustworthy and lets others repeat your work.
How many times should you repeat an experiment?
In school practicals at least three repeats for each condition is a sensible minimum, so you can spot an anomaly and calculate a mean. More repeats give a more reliable average. Professional studies may use hundreds of measurements. Your teacher or exam question may state how many to use.
What happens if the hypothesis is wrong?
Nothing has failed. A result that does not support your hypothesis still gives useful evidence. You check for errors in the method, then revise the hypothesis or ask a new question. Many scientific advances came from results that nobody expected, so honest reporting matters more than being right.
Who invented the scientific method?
No single person did. Ibn al-Haytham used experiments to study light around 1011 to 1021, Francis Bacon argued for evidence-based knowledge in 1620, and many others refined the ideas. Historians still debate how to credit individuals, because the method developed gradually across cultures and centuries.
Can the scientific method be used in everyday life?
Yes. You can use it whenever you want to test an idea, such as which revision method works better for you or which setting saves phone battery. Make a clear question, change one thing at a time, record what happens, and decide from the evidence rather than from habit or opinion.