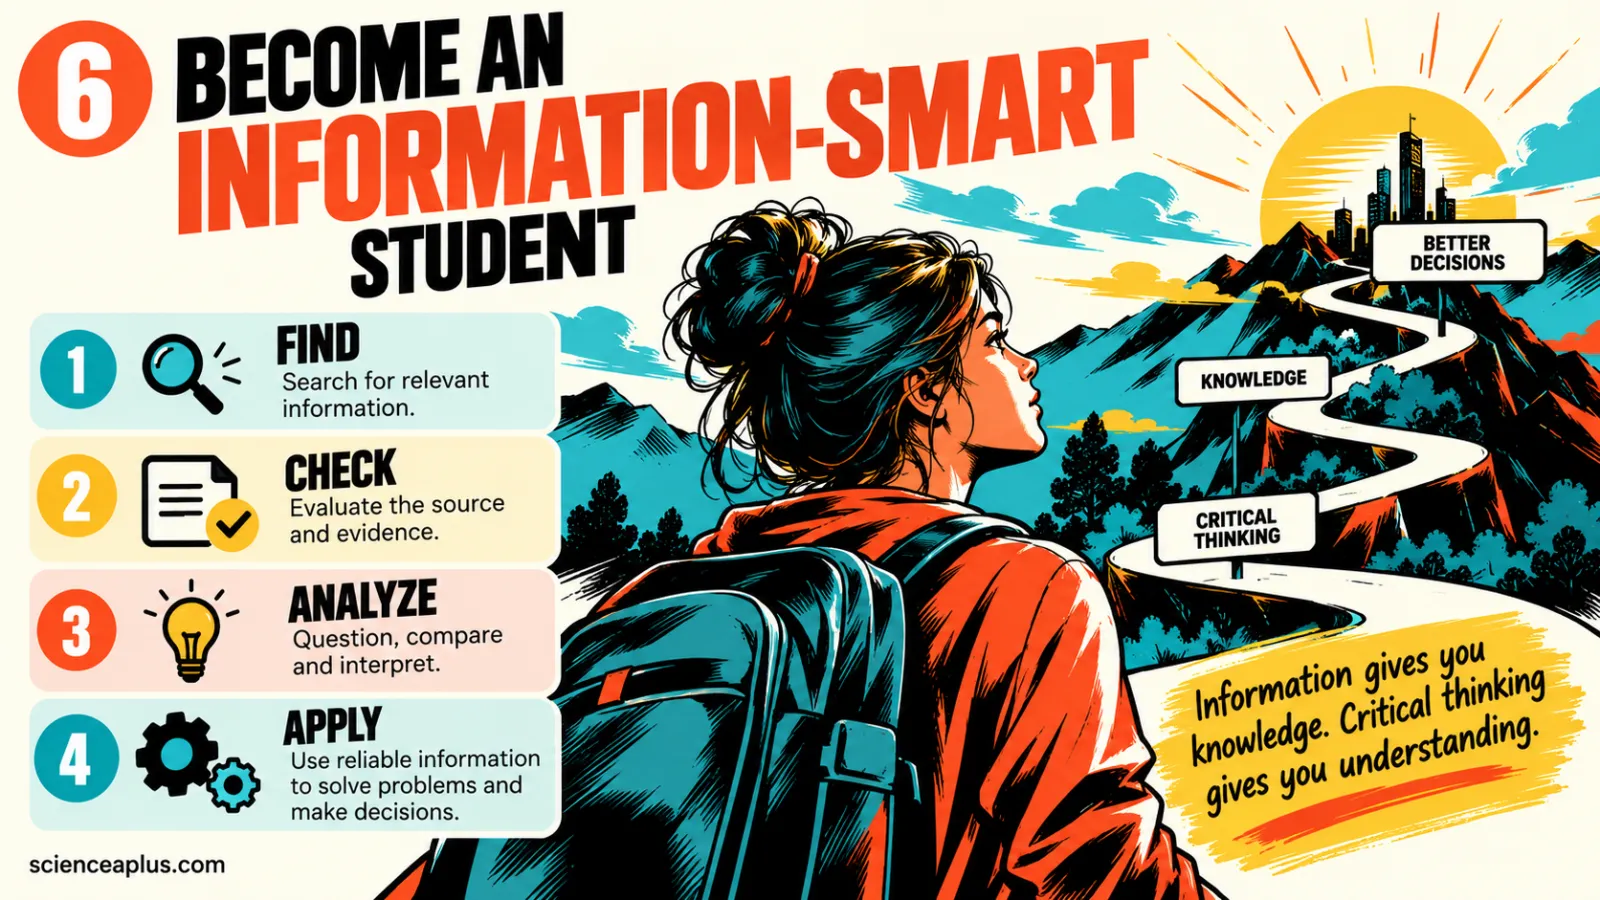
What are information skills for students? They are the skills you use to find information, check whether you can trust it, analyse what it really shows, and then use it honestly in your own work. In short: find, check, analyse, apply. They matter in GCSE exams, in coursework and every time you scroll through a feed.
What are information skills, and why do they matter at GCSE?
Accessing and analysing information sounds like something only researchers do. In fact you do it every day. You look something up for homework, read a post about a “miracle” diet, or try to make sense of a graph in a science paper. Each time, you have to decide what to search for, which results to believe and what the evidence actually says.
GCSE exams test these skills directly. Science papers give you unfamiliar data and ask you to describe a pattern, spot an anomalous result or judge a conclusion. Ofqual, the exams regulator in England, requires maths skills to make up at least 10% of the marks in GCSE Biology, 20% in Chemistry and 30% in Physics, and at least 20% in Combined Science. A big share of those marks come from reading tables and graphs.
History and geography sources questions, English non-fiction reading and any coursework or non-exam assessment (NEA) rely on the same habits. So do your life outside school: deciding which health advice to follow, which news to share and which online offer is a scam.
Good information skills are a practical form of critical thinking for science students. This guide walks through four steps that build on each other:
- Find – search for relevant information in the right places.
- Check – evaluate the source and the evidence before you trust it.
- Analyse – question, compare and interpret what you have found.
- Apply – use reliable information in notes, answers and coursework, and credit where it came from.
Step 1: Find the right information
Most bad research starts with a vague question. “Climate change” is a topic, not a question. “How does burning fossil fuels increase the amount of carbon dioxide in the atmosphere?” tells you exactly what you need, and it gives you the keywords to search with.
Turn your task into a search question
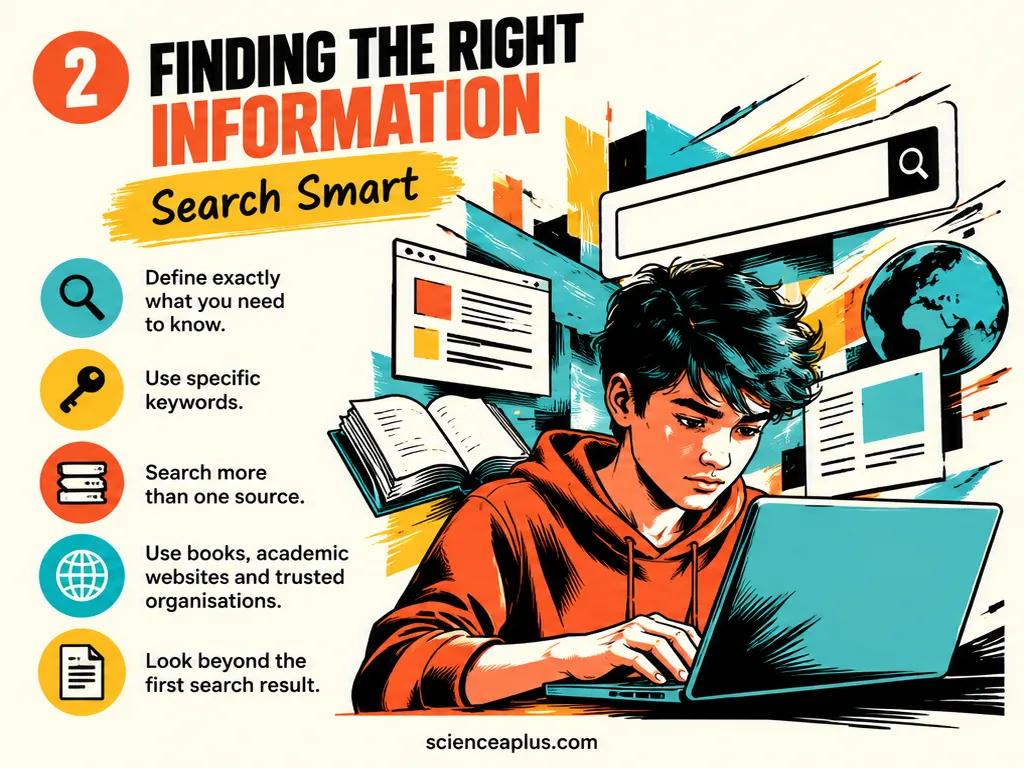
- Define exactly what you need to know. Underline the command word in the task (describe, explain, evaluate) and the topic words.
- Pick specific keywords. Use scientific terms from your specification rather than everyday words: “osmosis potato practical” beats “why do potatoes go floppy”.
- Search more than one source. One website is one opinion, even if it looks official.
- Look beyond the first result. The top results are often adverts or pages built to rank well, not the most accurate pages.
Search like a pro: three operators worth knowing
Search operators are small commands you type into a search engine to make the results sharper. Google and most other search engines support these three:
| Operator | What it does | Example |
|---|---|---|
| "quotation marks" | Finds that exact phrase, words in that order | "rate of photosynthesis" light intensity |
| site: | Only shows results from one website or type of domain | vaccines site:nhs.uk · acid rain site:ac.uk |
| - (minus) | Removes results containing a word | mercury planet -element |
The site: trick is especially useful. Typing site:gov.uk limits results to UK government pages, and site:ac.uk to UK universities. It does not guarantee every page is perfect, but it filters out a lot of noise.
Where to look first
Different questions need different sources. A good research trail usually moves from general to specific:
- Your textbook and class notes – written for your course, checked by teachers and examiners.
- Revision sites from trusted organisations – for example BBC Bitesize or your exam board’s own pages.
- Official and expert organisations – NHS for health, the Met Office for weather and climate, museums, the Royal Society of Chemistry, university websites.
- Libraries – your school or local library has books and often free access to encyclopedias and newspaper archives. Librarians are expert searchers; ask them.
- Wikipedia – a useful map of a topic and its keywords, and its reference list can point you to better sources. Use it to start, not to finish.

Primary or secondary source?
A primary source is first-hand: an original experiment, a set of data, a diary or an eyewitness account. A secondary source describes or interprets primary sources: a textbook, a news article about a study, a documentary. Secondary sources are easier to read, but details can get lost or twisted each time a story is retold. When a claim really matters, try to trace it back towards the primary source.
Scientific research is usually published in journals after peer review, which means other experts check the methods and conclusions before publication. Peer review does not make a paper perfect, but it is an important filter that most websites and social media posts never pass through.
Skim and scan before you read
You will not have time to read everything you find, and you do not need to. Skim a page first (title, headings, first lines of paragraphs, any summary) to decide whether it is relevant. Then scan for the keywords you need and read those parts carefully. These are the same techniques that help you read faster without losing understanding, and they stop you wasting twenty minutes on a page that never answers your question.
Once you have a handful of promising sources, the next job is the most important one: deciding whether they deserve your trust.
Step 2: Evaluate information – can you trust the source?
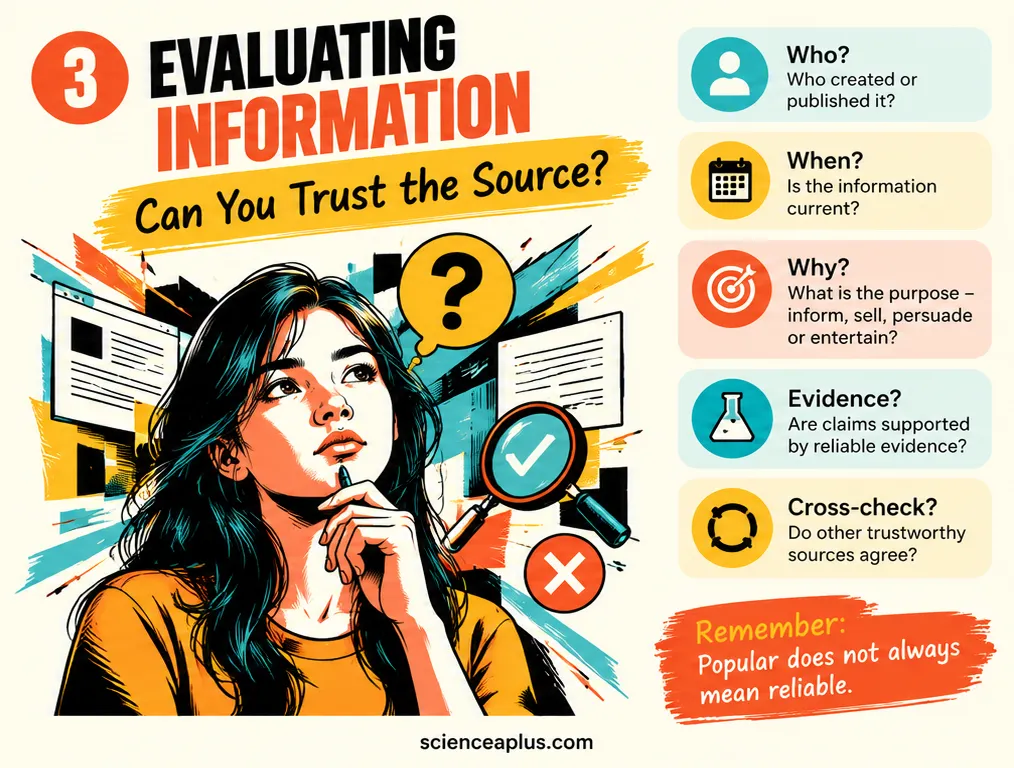
Evaluating sources is the step most students skip, and the one that matters most. A page can be well designed, top of the search results and shared thousands of times, and still be wrong. Popular does not always mean reliable.
Before you use anything, ask five quick questions: who made it, when, why, what evidence supports it, and do other trustworthy sources agree? Two well-known methods help you do this: the CRAAP test and lateral reading.
The CRAAP test
The CRAAP test was created in 2004 by Sarah Blakeslee, a librarian at California State University, Chico. The memorable name stands for five checks:
| Letter | Question to ask | Warning sign |
|---|---|---|
| Currency | When was it published or last updated? Is that recent enough for this topic? | No date, or old figures on a fast-moving topic such as technology or medicine |
| Relevance | Does it actually answer my question, at the right level? | Only loosely linked to your task, or far too basic or advanced |
| Authority | Who wrote or published it? What makes them qualified? | No author or organisation named; “experts say” without saying who |
| Accuracy | Is it backed by evidence? Can I check the facts elsewhere? | No sources, spelling errors, claims that no other reliable source makes |
| Purpose | Why does it exist: to inform, sell, persuade or entertain? | Selling a product, pushing one side only, emotional or angry language |
The CRAAP test is a good habit for books, articles and reports you already have in front of you. Its weakness is that you answer most questions by looking at the page itself, and a misleading website can easily look professional, quote “experts” and add a recent date.
Lateral reading: think like a fact-checker
Researchers at the Stanford History Education Group (SHEG) wanted to know how experts actually judge websites. Sam Wineburg and Sarah McGrew watched 45 people evaluate live websites: 10 historians with PhDs, 10 professional fact-checkers and 25 Stanford University undergraduates. Their study was published in the journal Teachers College Record in 2019.
The historians and students mostly read vertically. They stayed on the website, studied its “About” page, and were often fooled by official-looking logos and domain names. The fact-checkers did something different. They read laterally: after a quick look, they left the site and opened new tabs to find out what other sources said about it. They reached better-supported conclusions in a fraction of the time.


Lateral reading in practice:
- Glance at the page – what is it claiming, and who seems to be behind it?
- Open a new tab and search the name of the organisation or author, plus words like “funding” or “who runs”.
- See what reliable sources (news organisations, encyclopedias, fact-checkers) say about them.
- Search the claim itself. Do trustworthy sources report the same thing?
- Only then go back and read the original page in detail, if it still seems worth it.
This matters because many young people find it hard. In a 2016 SHEG report based on 7,804 student responses from 12 US states, the researchers summed up students’ ability to judge online information in one word: “bleak”. More than 80% of the middle-school students tested believed an advert labelled “sponsored content” was a real news story. In a later national study of 3,446 US high-school students (2018–2019), two-thirds could not tell news stories from ads labelled “Sponsored Content”. These were US students, but there is no reason to think the problem stops at the border. SHEG’s work on online reasoning is now continued by the Digital Inquiry Group.
SIFT: lateral reading in four moves
Misinformation researcher Mike Caulfield turned lateral reading into a quick routine called SIFT (2019):
- S – Stop. Pause before you share, believe or copy. Do you know this source?
- I – Investigate the source. Spend 30 seconds finding out who is behind it.
- F – Find better coverage. Look for the same claim from a source you already trust.
- T – Trace claims to the original context. Follow quotes, images and statistics back to where they first came from.
Misinformation, deepfakes and AI-generated content in 2026
Misinformation is false or misleading information shared without meaning to deceive, like a friend forwarding a fake “fact”. Disinformation is false information spread on purpose. Both travel fast on social media, where posts that get lots of reactions tend to spread further, whether or not they are true. The benefits and downsides of social media both come from that speed.
Generative AI has added a new layer. Ofcom’s Children and Parents: Media Use and Attitudes report (May 2026) found that 56% of UK 8–17-year-olds say they have used AI, rising to 66% of 16–17-year-olds. Four in ten teenage AI users said they would trust an AI-written news article as much as, or more than, one written by a human.
AI chatbots can be genuinely useful for explaining ideas or suggesting search terms. But they predict likely-sounding text rather than looking facts up, so they can produce confident answers that are simply wrong, including references to books and papers that do not exist. These are often called “hallucinations”. In a famous 2023 case in New York (Mata v. Avianca), two lawyers and their law firm were fined $5,000 after submitting a court document containing six made-up cases invented by ChatGPT. If professionals can be caught out, so can a Year 10 homework. Read more about AI in writing assistance and where it helps.
How to check AI content, images and videos
- Treat AI answers as a starting point. Check every fact and every reference in a reliable source before you use it.
- Find the original. Where did this image, quote or video first appear? Who posted it, and when?
- Use a reverse image search (for example Google Lens or TinEye) to see where else a picture has appeared. Old photos are often re-shared as “breaking news”.
- Look for the story on trusted news sites and UK fact-checkers such as Full Fact, an independent fact-checking charity founded in 2009, or BBC Verify, launched in 2023.
- Don’t rely on labels. Some countries are bringing in rules for labelling AI content (the EU’s AI Act transparency duties began to apply in August 2026), but labels can be missing, wrong or removed. Your own checking is still the best defence.
Step 3: Analyse information – look beyond the facts
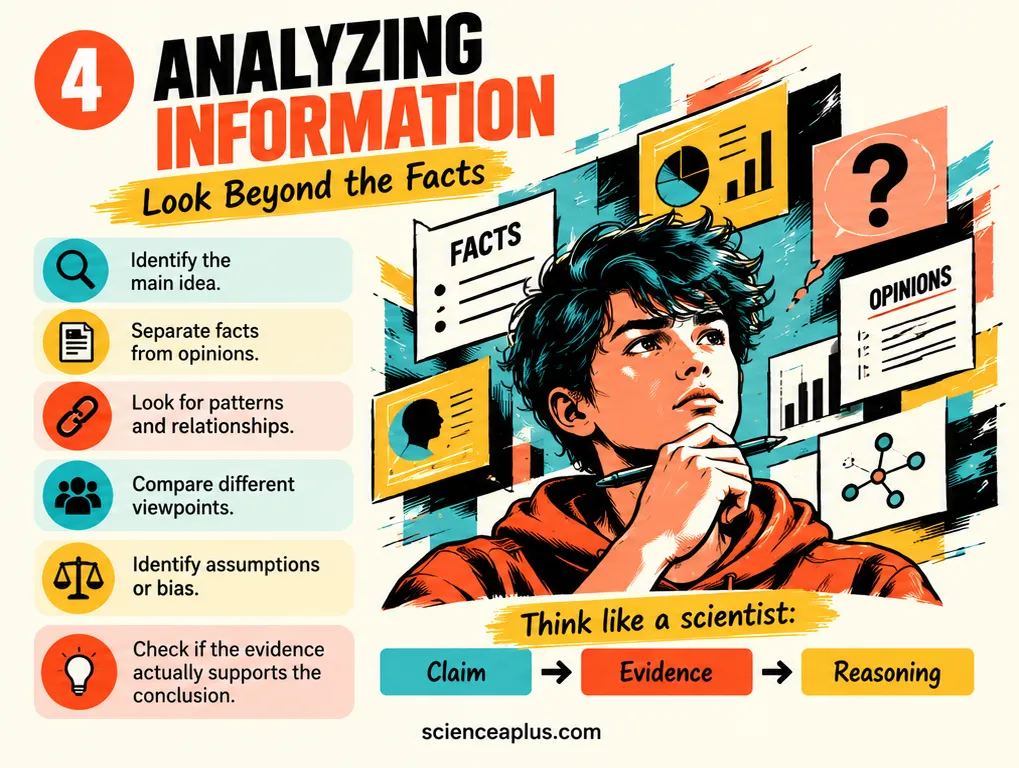
Once you trust a source, the next job is working out what it actually says, and what it doesn’t. Analysing information means reading actively: asking questions as you go rather than just collecting sentences.
- Identify the main idea. Can you sum up the source in one sentence? If not, you haven’t understood it yet.
- Separate facts from opinions. A fact can be checked (“water boils at 100 °C at sea level”). An opinion is a judgement (“nuclear power is the best energy source”). Opinions can be well argued, but they are not evidence on their own.
- Look for patterns and relationships. What causes what? What increases when something else increases?
- Compare different viewpoints. What do sources agree on, what do they disagree on, and which one has stronger evidence?
- Identify assumptions and bias. Who benefits if you believe this? What has been left out?
- Check that the evidence really supports the conclusion. A small survey of ten people cannot prove something about everyone.
Think like a scientist: claim, evidence, reasoning
A simple framework for any argument is claim → evidence → reasoning. The claim is what someone says is true. The evidence is the data or observations offered as support. The reasoning explains why the evidence supports the claim. Weak arguments usually have a gap: a big claim, thin evidence, or no reasoning connecting the two.
Try it on a headline such as “Chocolate helps you lose weight”. What exactly is the claim? What study is the evidence, how many people took part, and who paid for it? Does the reasoning explain how chocolate would cause weight loss, or does it just report that two things happened together?
Test yourself with these cards. Decide whether each statement is a fact, an opinion or a sign of bias, then tap to check.
Making notes that actually help
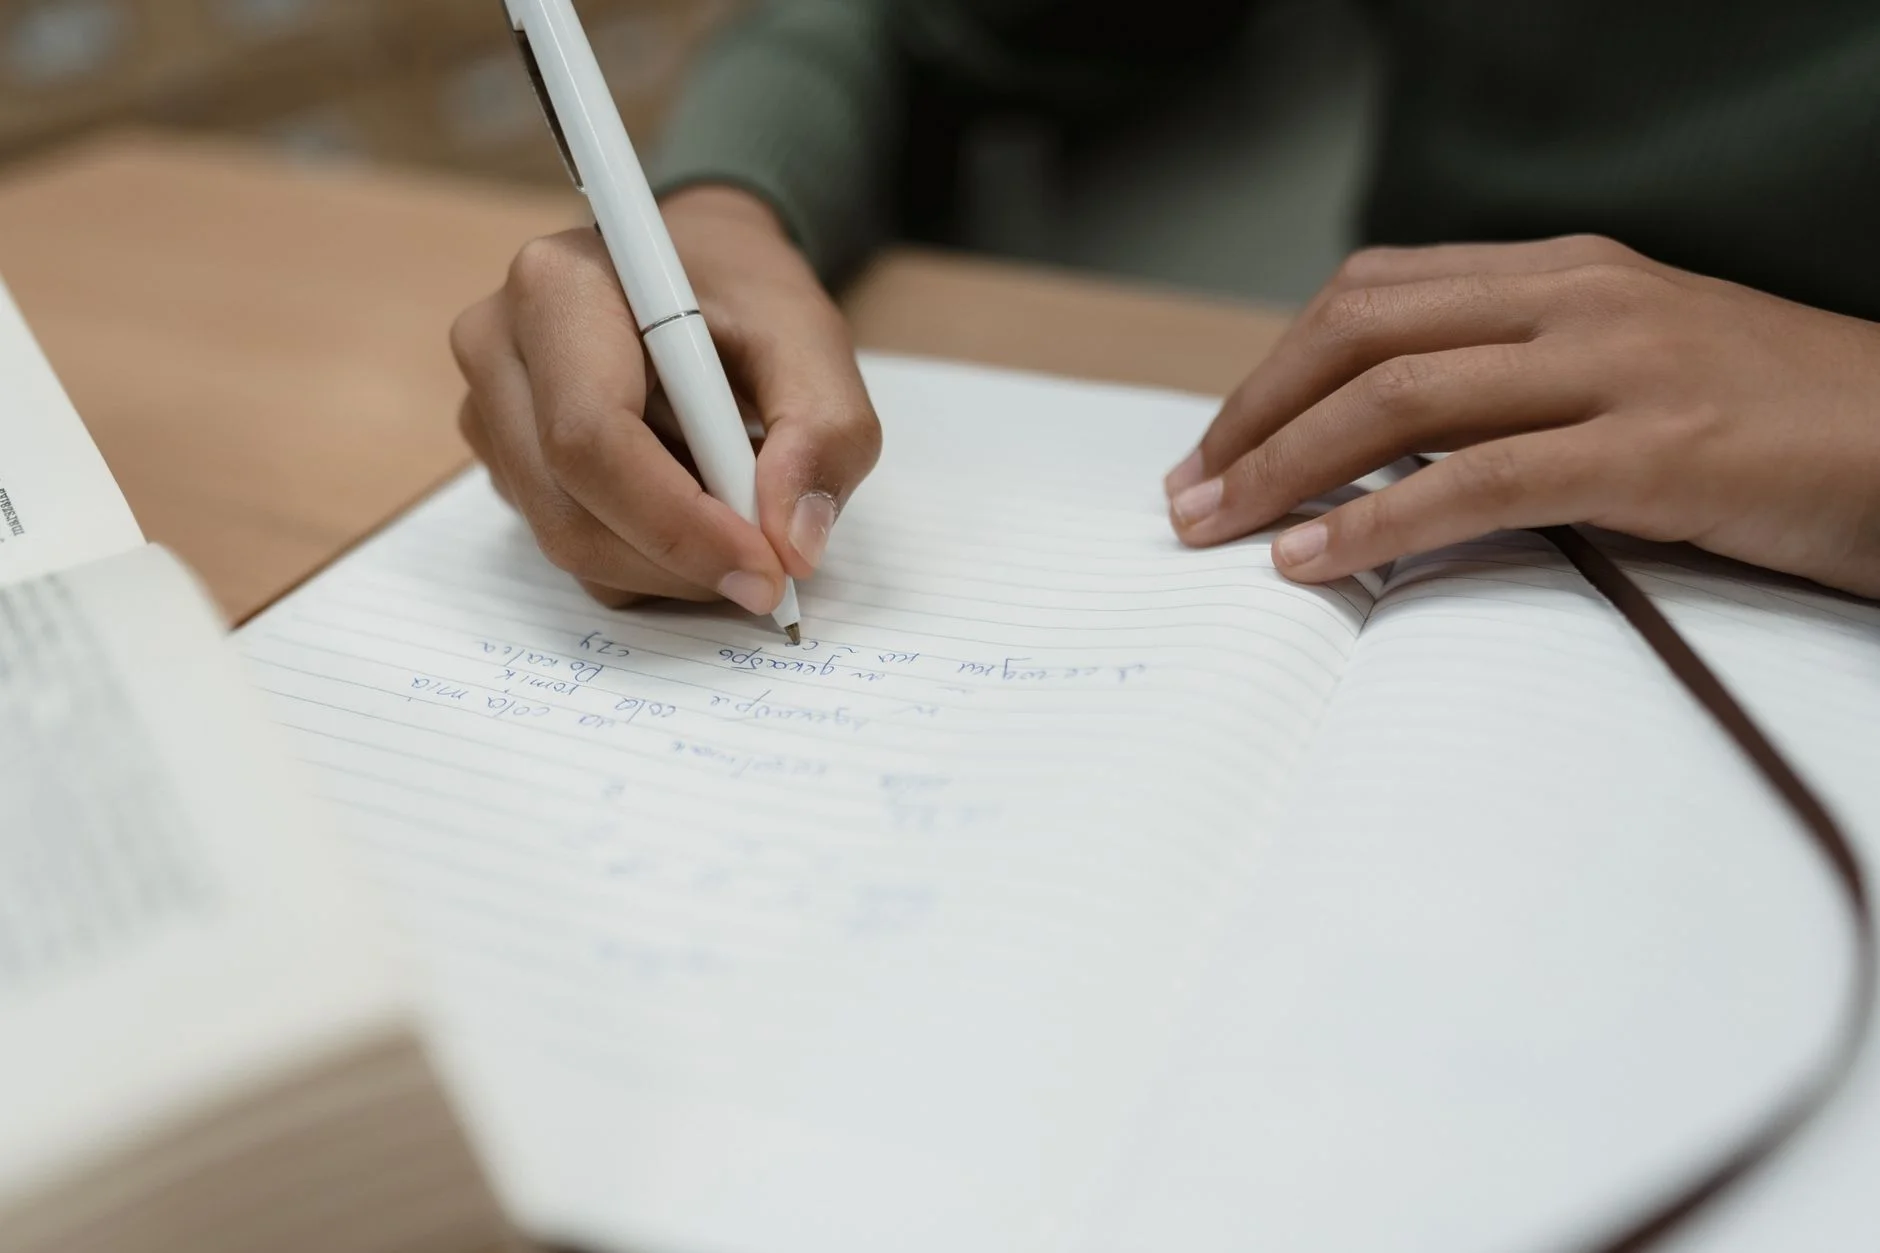
Notes are where accessing and analysing information turns into learning. Copying out paragraphs feels productive, but it mostly moves words from one place to another. Good notes are short, in your own words and organised so you can find things again.
The Cornell method
The Cornell note-taking system was devised in the 1950s by Walter Pauk at Cornell University and made popular by his book How to Study in College (1962). Split your page into three parts:
- Notes column (right, about two-thirds of the width): key points, diagrams and examples as you read or listen.
- Cue column (left, narrow): afterwards, write questions or keywords that the notes answer, such as “What are the products of photosynthesis?”
- Summary (bottom strip): two or three sentences summing up the whole page in your own words.
To revise, cover the notes column and try to answer the questions in the cue column. That turns your notes into a ready-made self-test, one of the most effective ways to practise and remember what you study.
Mind maps, tables and source lists
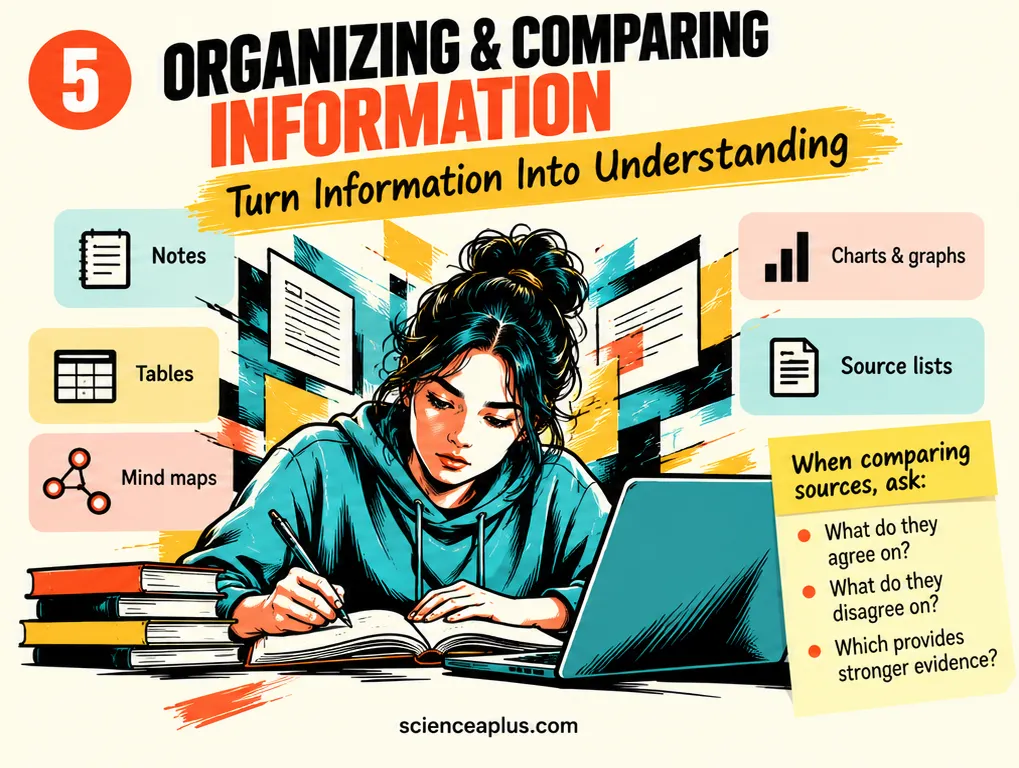
Choose the format that fits the information:
- Mind maps for topics with many linked ideas, such as the factors affecting enzyme activity.
- Tables for comparing things side by side: mitosis vs meiosis, or what three sources say about the same question.
- Charts and graphs for numbers you want to see patterns in.
- A source list kept as you go: title, author or organisation, date and web address for everything you use. It saves hours when you write your references.
Referencing: give credit where it’s due
Referencing means telling your reader exactly where your information came from. It shows which ideas are yours and which are someone else’s, lets readers check your evidence, and protects you from plagiarism: presenting other people’s work as your own. In GCSE coursework and NEA, plagiarism counts as malpractice and can cost you marks or the whole qualification.
A simple Harvard-style reference
Schools use different styles, so check what your teacher wants. Harvard style is common in the UK. You put a short reference in your text, like (Pauk, 1962), and a full reference in a list at the end:
- Book: Surname, Initial. (Year) Title. Place: Publisher.
- Website: Organisation or Author (Year) Title of page. Available at: web address (Accessed: date).
When a web page has no named author, use the organisation, for example (NHS, 2025). The “Accessed” date matters because web pages change. These habits will also help with writing a science essay and with oral and written communication skills generally.
Acknowledging AI in coursework
The Joint Council for Qualifications (JCQ), which sets shared exam rules for the main UK exam boards, published updated guidance called AI Use in Assessments in April 2025. It says students must acknowledge any AI use in assessed work, naming the tool and the date it was used, and keep a non-editable copy (such as a screenshot) of the questions asked and the answers produced.
The guidance lists copying or paraphrasing AI-generated content so the work is no longer your own, and failing to acknowledge AI used as a source of information, as misuse. Content produced by AI does not earn you marks as your own work, and serious cases can lead to disqualification.
Interpreting data and graphs in GCSE science
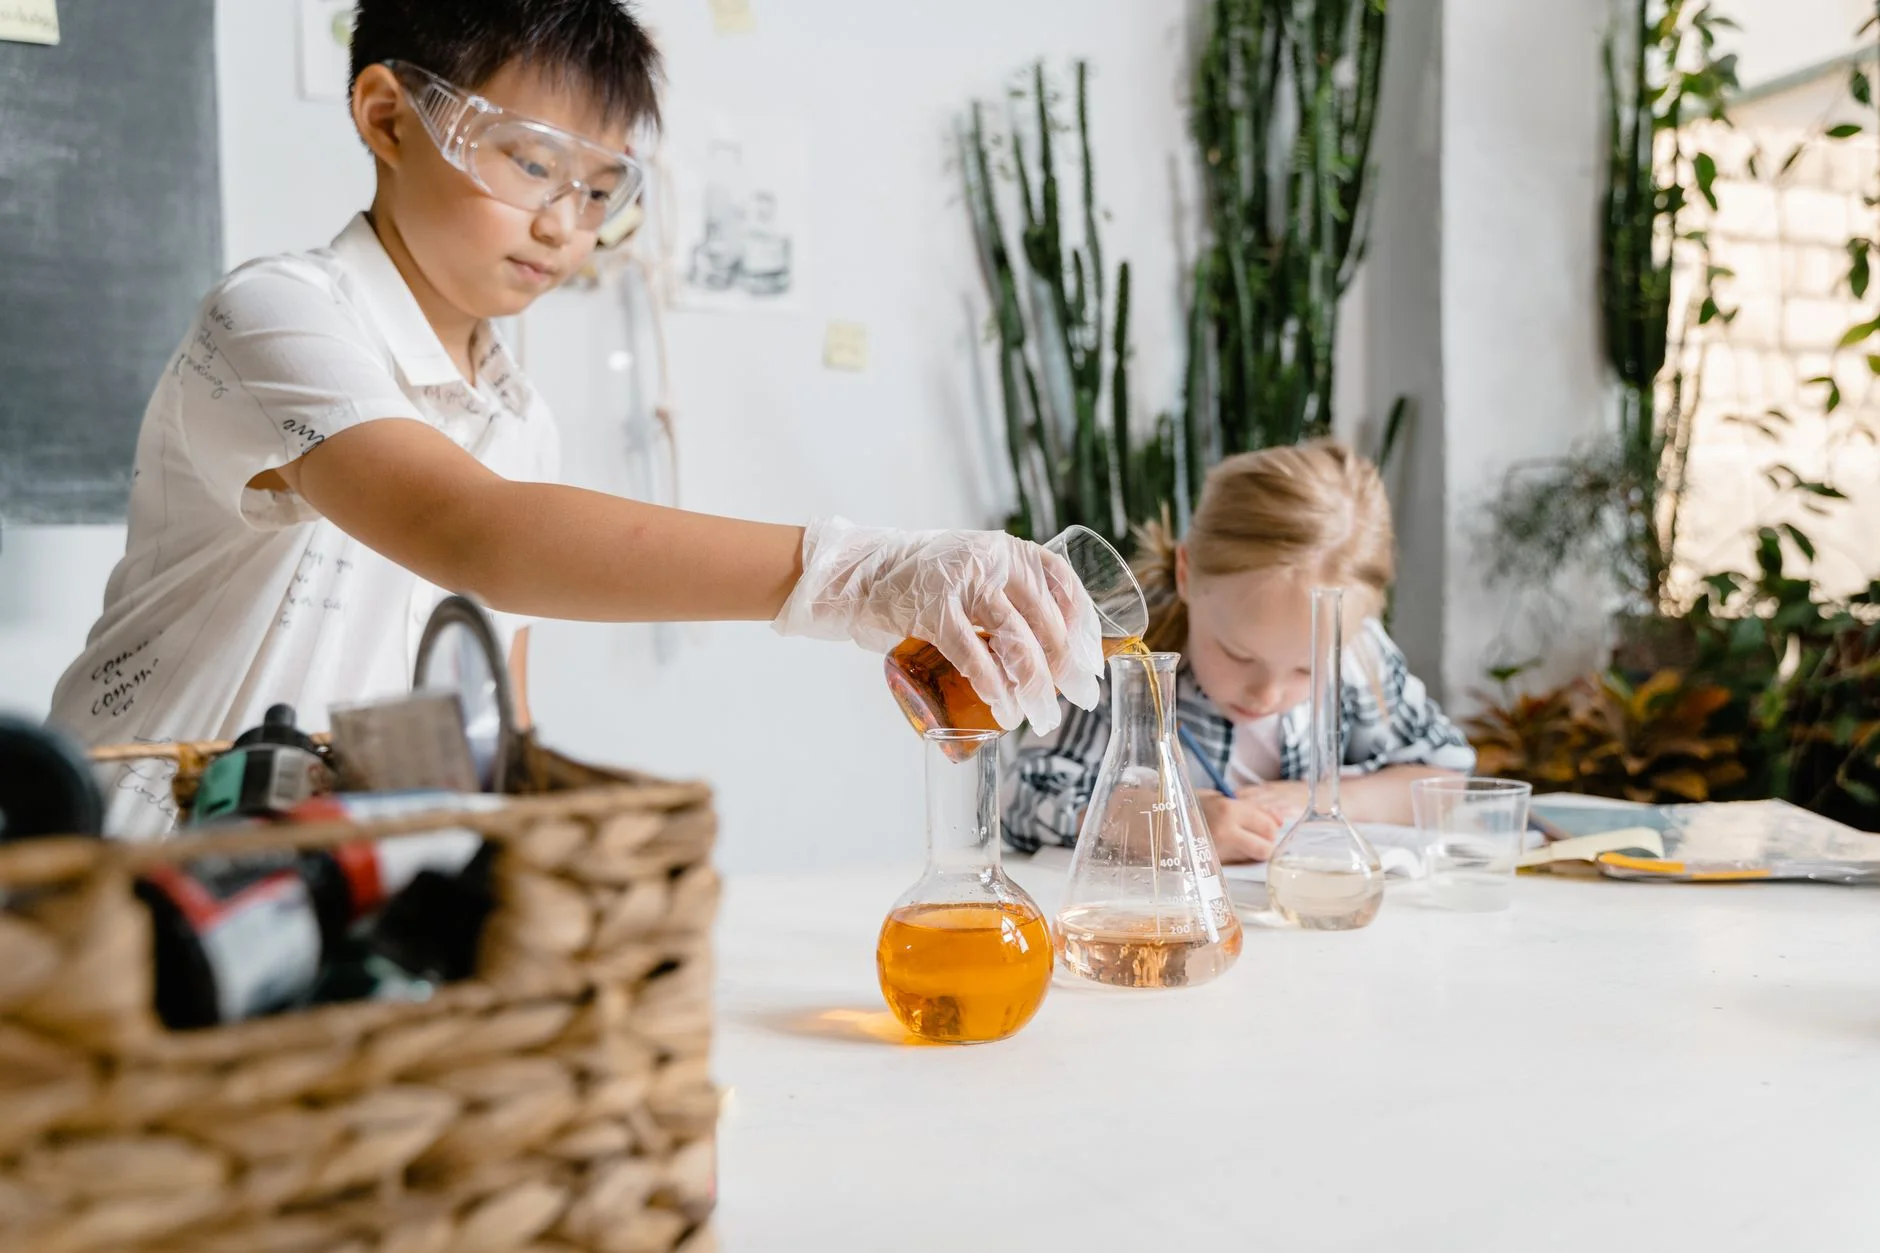
In science, the information you analyse is often numbers: results from your own required practicals, or tables and graphs printed in the exam. The same rule applies as with any source. Read carefully, describe what it really shows, and don’t claim more than the evidence supports. Every investigation follows the steps of the scientific method, and data analysis is where you test whether your prediction held up.
Reading a graph: the five-point check
- Axes. The independent variable (the one you change) goes on the x-axis; the dependent variable (the one you measure) goes on the y-axis. Each axis should show the quantity and its unit, such as “temperature (°C)”.
- Type of graph. Line graphs suit continuous data (temperature, time, concentration); bar charts suit categoric data (types of food, different metals).
- Trend. Describe the pattern in words and numbers: “As temperature increases from 20 °C to 40 °C, the rate of reaction increases.”
- Gradient. On a straight line, the gradient tells you the rate of change: gradient = change in y ÷ change in x. A steeper line means a faster change.
- Anomalies. Any point that clearly doesn’t fit the pattern. Circle it, suggest a reason, and don’t let it drag your line of best fit off course.
Mean, range and uncertainty
Repeat readings make your results more reliable. To process them:
- Mean = total of the readings ÷ number of readings. Leave out any anomalous result you can explain, and say that you did.
- Range = largest reading − smallest reading. A small range means your repeats were close together.
- Uncertainty ≈ ± half the range. If the range is 0.4 s, the uncertainty is about ± 0.2 s.
Type some repeat readings into the calculator below to check your working. Never ignore an odd result just because it is inconvenient; only leave it out if you can explain it, such as a misread scale or a timing slip.
mean = (x₁ + x₂ + … + xₙ) ÷ n
The maths in these questions is not hard, but it is easy to rush. Practising with real data, like this guide to maths skills in GCSE cell biology, builds speed and accuracy.
Correlation is not causation
Two variables are correlated when they change together. That does not prove one causes the other. Ice cream sales and sunburn cases both rise in summer, but ice cream doesn’t cause sunburn: a third factor, hot sunny weather, drives both. Before you accept that A causes B, ask whether there could be another factor, whether it could be coincidence, and whether there is a scientific mechanism that explains the link.
A student finds that people who drink more coffee have higher stress levels. They conclude that coffee causes stress. Evaluate this conclusion. (3 marks)
The data only shows a correlation, not that coffee causes stress. A third factor could explain both, for example people with busy, stressful jobs may drink more coffee. Stress could even cause people to drink more coffee. A controlled experiment that changes only coffee intake would be needed to test cause and effect.
Repeat readings for the time taken for a reaction were 42 s, 44 s, 43 s and 58 s. Calculate the mean, leaving out any anomaly. (2 marks)
58 s is anomalous because it is far from the other three readings. Mean = (42 + 44 + 43) ÷ 3 = 129 ÷ 3 = 43 s.
Why should a graph’s y-axis label include a unit? (1 mark)
So the reader knows what the numbers measure and how big they are; for example, 5 could mean 5 seconds or 5 minutes.
Your information skills checklist
Use this list every time you research a homework, an essay or a coursework task. Your ticks are saved in this browser, so you can come back to it.
- I wrote my task as a clear question with specific keywords.
- I searched more than one type of source (textbook, trusted organisation, library).
- I checked who made each source, when and why.
- I read laterally: I looked up unfamiliar sites and claims in a new tab.
- I checked any AI answers and references against reliable sources.
- I separated facts from opinions and looked for bias.
- I made notes in my own words and kept a source list as I went.
- I referenced every source and acknowledged any AI use, as my school requires.
These habits fit straight into your revision too. If you are planning ahead, see how to start revising for GCSE science.
Frequently asked questions about information skills for students
What are information skills?
Information skills are the abilities you need to find information, judge whether it is reliable, analyse what it shows and use it honestly. They include searching effectively, evaluating sources, spotting bias and misinformation, making notes, referencing and interpreting data. They help with GCSE exams, coursework and everyday decisions online.
How can I tell if a website is reliable?
Check who runs it, when it was updated, why it exists and what evidence it gives. Then read laterally: open a new tab and search for the website or author to see what trusted sources say about them. Reliable information usually appears on several independent, trustworthy sites, not just one.
What does CRAAP stand for?
CRAAP stands for Currency, Relevance, Authority, Accuracy and Purpose. It is a checklist for evaluating sources, created in 2004 by librarian Sarah Blakeslee at California State University, Chico. It works well for books and articles, but combine it with lateral reading for websites, which can easily look more trustworthy than they are.
What is lateral reading?
Lateral reading means leaving a website soon after opening it and checking what other sources say about the site and its claims. Stanford researchers Sam Wineburg and Sarah McGrew found that professional fact-checkers worked this way and judged websites more accurately and faster than historians and university students, who stayed on the page.
How can I spot AI-generated content or deepfakes?
Don’t rely on how real something looks. Find where the image, video or text first appeared and who posted it. Use a reverse image search, look for the story on trusted news sites or fact-checkers such as Full Fact and BBC Verify, and be wary of content designed to make you angry or shocked.
Can I use AI for GCSE coursework?
Only if your school and the task allow it. JCQ guidance says any AI use must be acknowledged, with the tool and date, and you should keep a copy of what it produced. Copying or paraphrasing AI content as your own work is misuse and can be treated as malpractice. Always ask your teacher first.
Is Wikipedia a reliable source?
Wikipedia is a useful starting point for understanding a topic and finding keywords, and its reference lists can lead you to better sources. Because anyone can edit it and articles vary in quality, most teachers prefer you not to cite it directly. Follow its references to the original sources and cite those instead.
How do I reference a website in Harvard style?
Write the author or organisation, the year in brackets, the page title in italics, then “Available at:” with the web address and “(Accessed: date)”. In your text, put the author or organisation and year in brackets, for example (NHS, 2025). Check whether your school uses a slightly different version.
What is the difference between correlation and causation?
Correlation means two variables change together. Causation means a change in one actually produces a change in the other. A correlation can be caused by a third factor or by coincidence, so it does not prove cause and effect. Controlled experiments, where only one variable is changed, are needed to test causation.