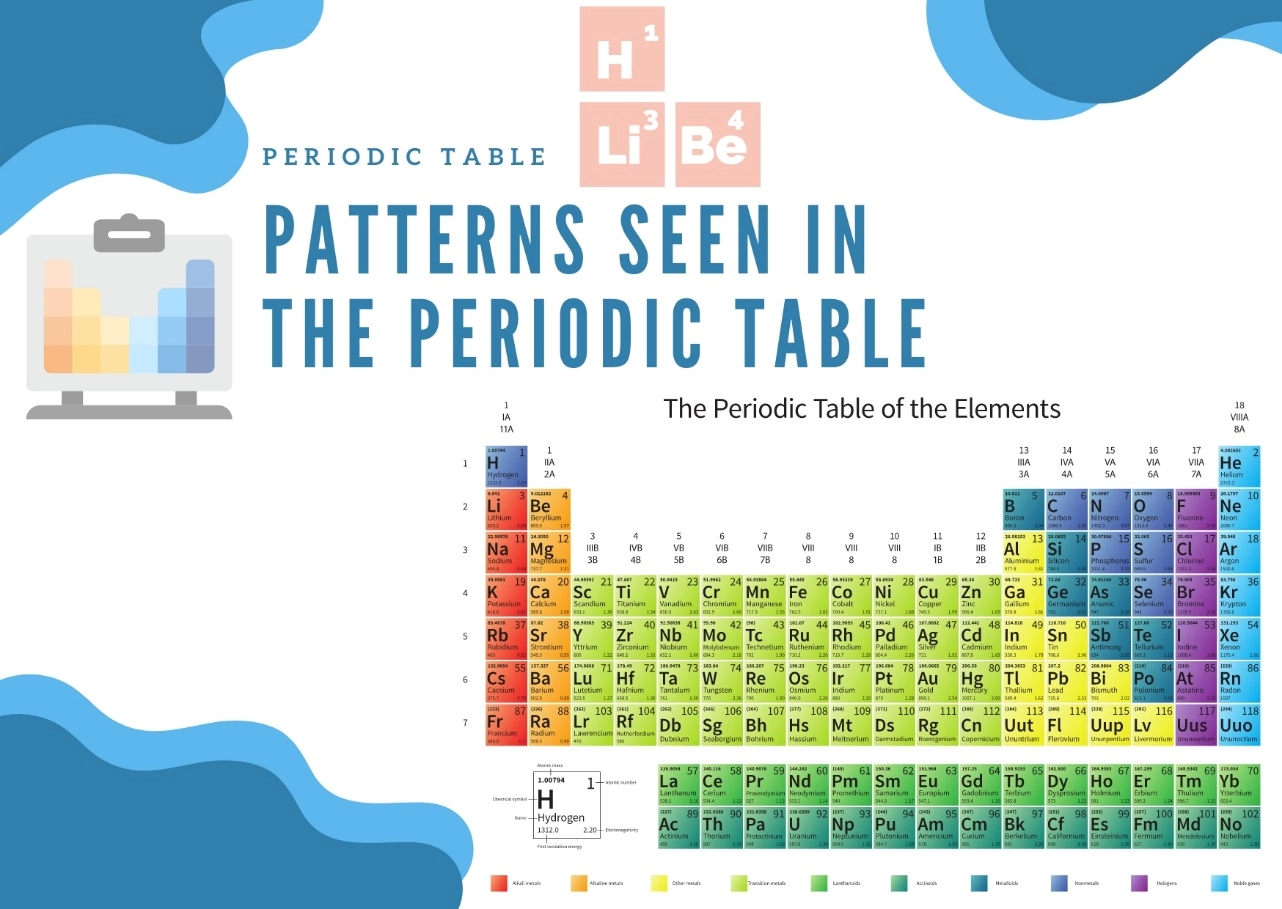
The Periodic Table, which is based on the atomic number and electronic configuration, reveals a systematic pattern of elements. Dmitri Mendeleeff, a Russian scientist, first introduced a Periodic Table for classifying elements, where horizontal rows are called Periods and vertical columns are known as Groups.
The physical and chemical properties of elements change across a Period from left to right and from top to bottom of a Group.
By examining the properties of the elements such as first ionization energy, electronegativity, metals/non-metals/metalloids and acidic/basic/amphoteric nature of oxides, one can study these patterns.
First ionization energy
The first ionization energy of an element is the minimum energy required to remove an electron to form a unipositive gaseous ion. In a given Period, Group I elements have the minimum first ionization energy, while Group VIII elements have the maximum ionization energy. From left to right in a Period, the first ionization energy varies in a regular manner. The ionization energy decreases from top to bottom of a Group, as the number of energy levels in an atom increases, making the removal of electrons easier.
Graph of ionization energy variation against atomic number for first 20 elements
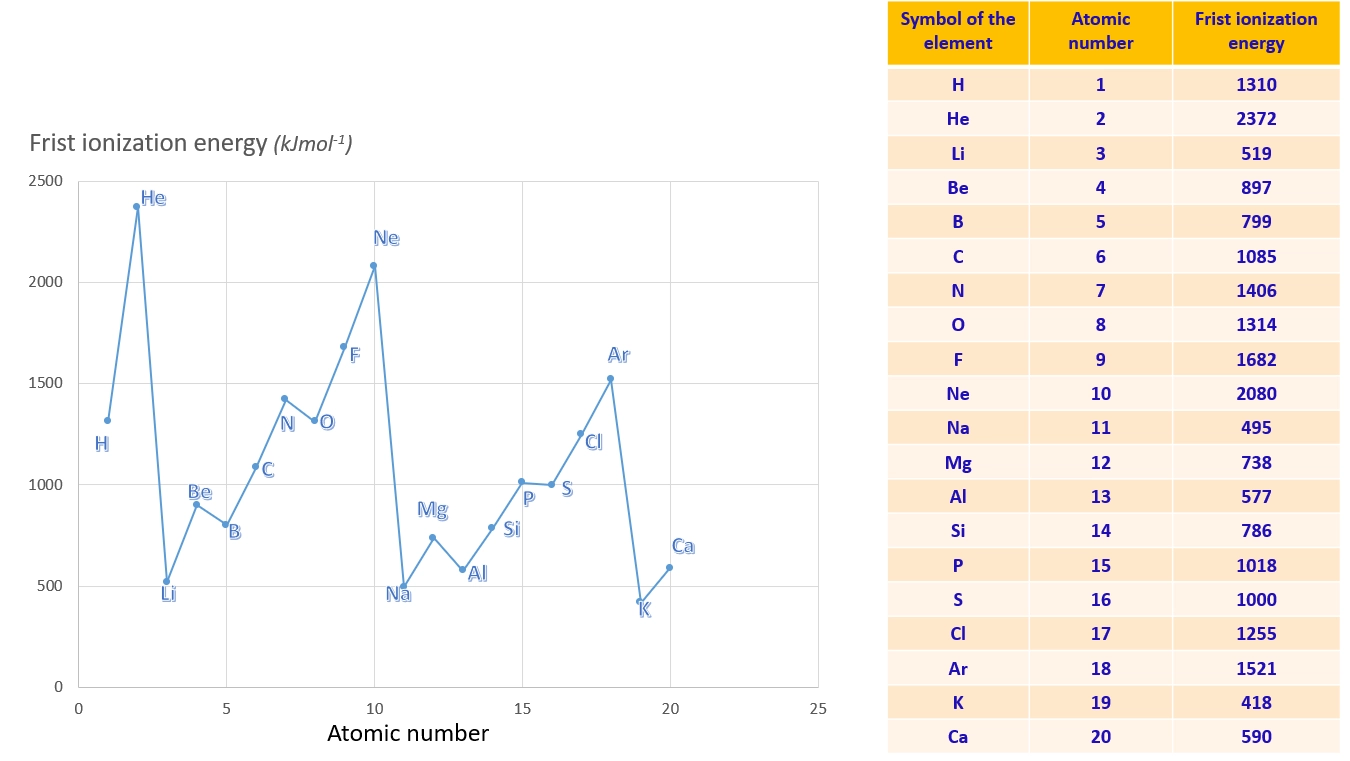
First ionization energies of the first 20 elements
The graph above is plotted from the values below. Here they are as text so that you can read a value off directly, copy it into your notes and check your own answers.
| Symbol of the element | Atomic number | First ionization energy (kJ mol−1) |
|---|---|---|
| H | 1 | 1310 |
| He | 2 | 2372 |
| Li | 3 | 519 |
| Be | 4 | 897 |
| B | 5 | 799 |
| C | 6 | 1085 |
| N | 7 | 1406 |
| O | 8 | 1314 |
| F | 9 | 1682 |
| Ne | 10 | 2080 |
| Na | 11 | 495 |
| Mg | 12 | 738 |
| Al | 13 | 577 |
| Si | 14 | 786 |
| P | 15 | 1018 |
| S | 16 | 1000 |
| Cl | 17 | 1255 |
| Ar | 18 | 1521 |
| K | 19 | 418 |
| Ca | 20 | 590 |
Observations show that in Group I elements, the values of the first ionization energy decrease from the top to the bottom of the Group. This trend is also observed in other groups. Hence, it can be inferred that the ionization energy decreases from the top to the bottom of a Group. When moving down a Group, the number of energy levels in an atom increases, reducing the attraction between the nucleus and the outermost electrons. Consequently, it becomes easier to remove electrons.
Electronegativity
When an atom is connected to an atom of another element, this property is known as electronegativity and allows the atom to draw electrons to itself. The electronegativity increases from left to right across a Period and decreases down a Group. Fluorine is considered the element of highest electronegativity.
According to the Pauling scale, fluorine is the element with the highest electronegativity. Various scales are used to measure electronegativity, but in this context, we are considering the Pauling scale. However, electronegativity values are not assigned to noble gases as they tend to show low reactivity.
The graph below displays the variation of electronegativity values. It is evident that electronegativity increases from left to right within a period, while it decreases from top to bottom within a group.
Electronegativity values of first 20 elements
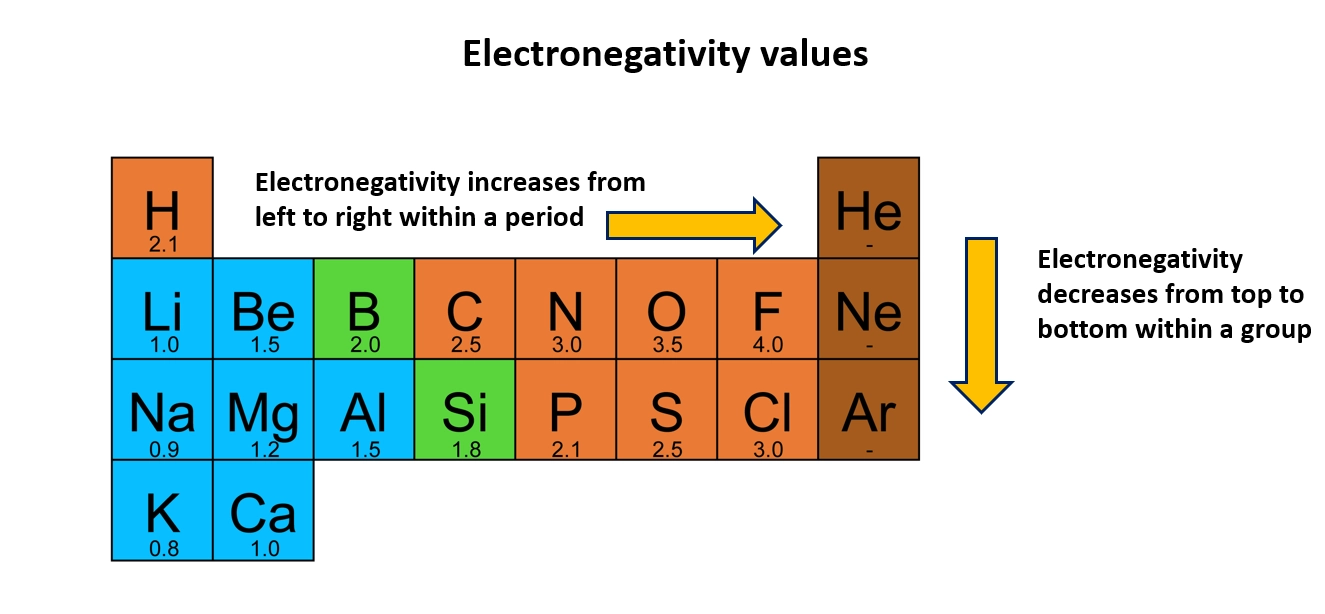
Electronegativity values as text
The same values as in the diagram above, listed in order of atomic number. Reading down the list you can see the value rise across a period and fall again at the start of the next one. Noble gases are not given a value.
| Element symbol | Electronegativity (Pauling scale) |
|---|---|
| H | 2.1 |
| He | – |
| Li | 1.0 |
| Be | 1.5 |
| B | 2.0 |
| C | 2.5 |
| N | 3.0 |
| O | 3.5 |
| F | 4.0 |
| Ne | – |
| Na | 0.9 |
| Mg | 1.2 |
| Al | 1.5 |
| Si | 1.8 |
| P | 2.1 |
| S | 2.5 |
| Cl | 3.0 |
| Ar | – |
| K | 0.8 |
| Ca | 1.0 |
Metals, Non - metals and Metalloids
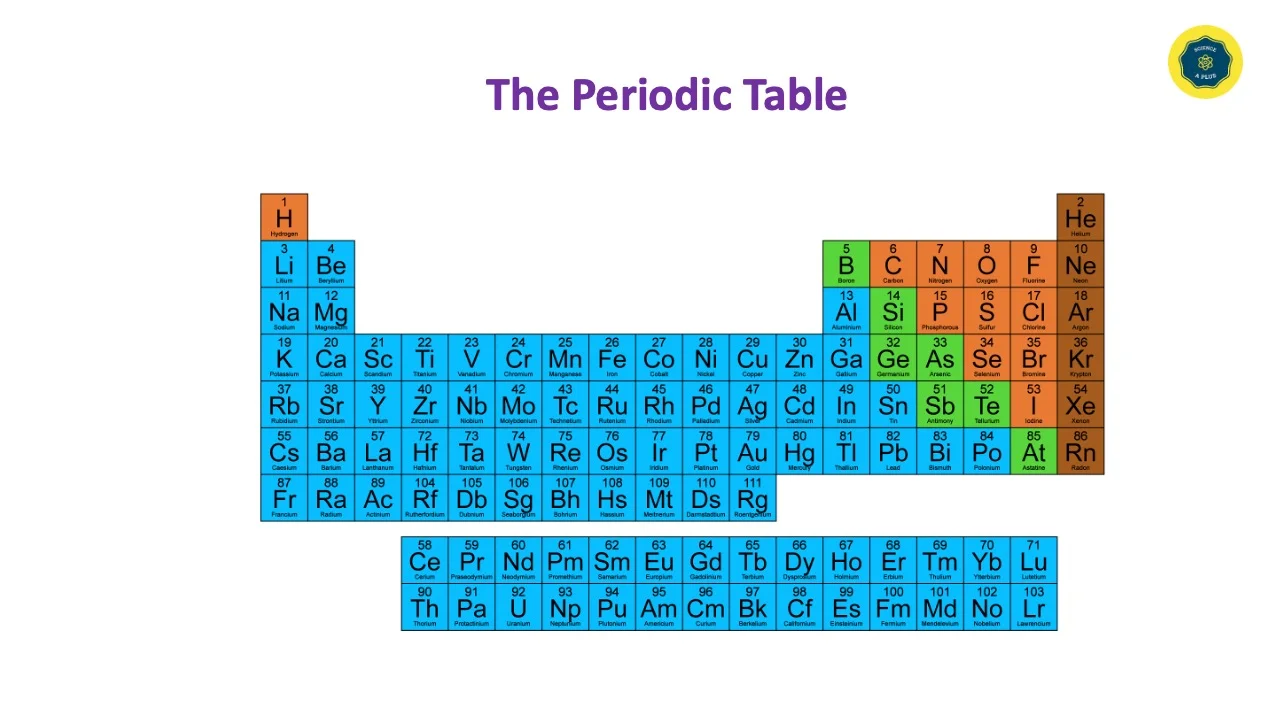
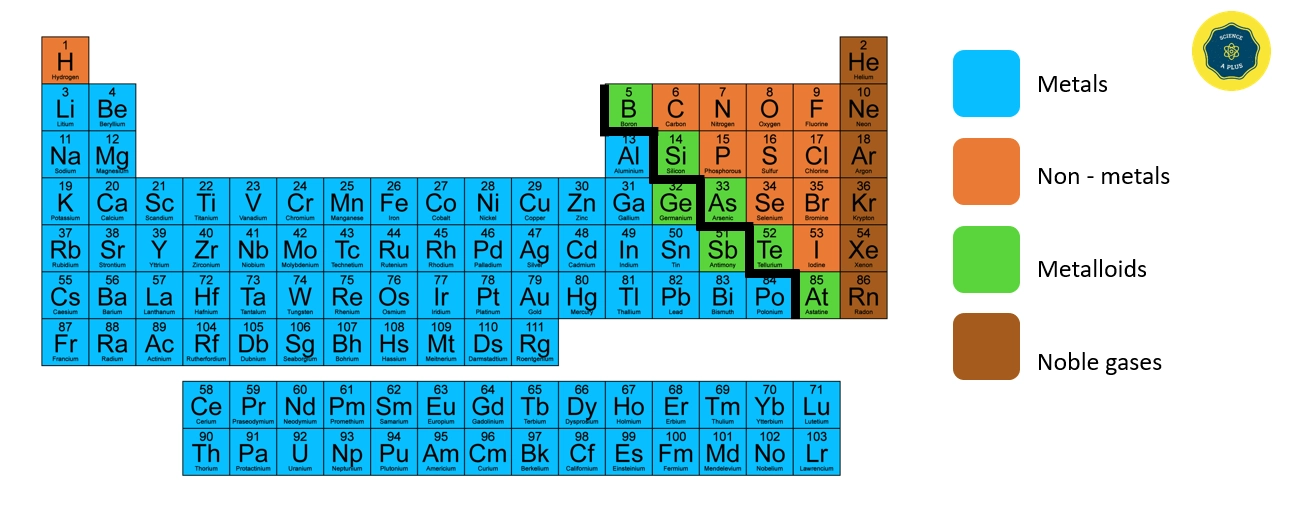
The elements in blue on the left side of the Periodic Table are metals, while those in brown on the right side are non-metals. The elements around the steps in light green are metalloids.
Non-metals can be found as native elements or as compounds of other elements. Their physical state can vary, with some existing as solids, liquids, or gases at room temperature. For example, carbon, sulfur, phosphorus, and iodine exist as solids at room temperature, while bromine is a liquid and chlorine, fluorine, nitrogen, and oxygen are gases. Non-metals lack a metallic luster and cannot be shaped into sheets or wires. They are often brittle and poor conductors of heat and electricity, although graphite is a notable exception as it can conduct electricity. Non-metals generally have a lower density than metals, but diamond, a form of carbon, has a high density.
Metals, Non - metals and Metalloids in the Periodic Table
Acidic, basic and amphoteric nature of oxides
What is an Oxide?
An oxide is a chemical compound that combines an element with oxygen.
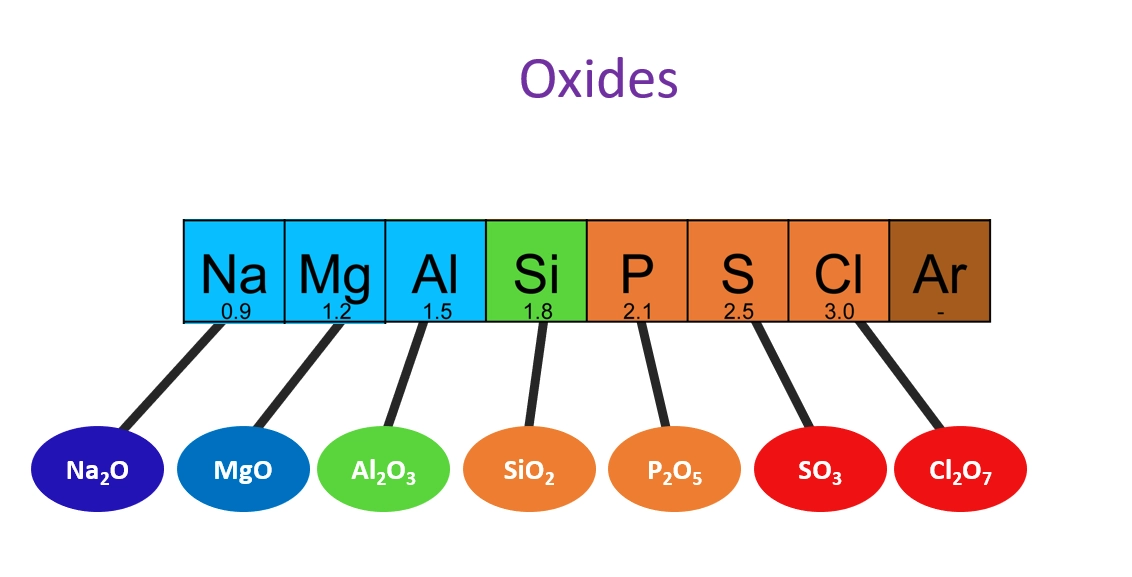
The acidic and basic properties of oxides vary across a Period. For example, the oxide of sodium is strongly basic, while magnesium oxide is weakly basic. The acidity of oxides increases from silicon to chlorine, and aluminum oxide shows both acidic and basic properties, making it an amphoteric oxide. From left to right of a Period in the Periodic Table, the basicity of the oxides decreases and their acidity increases.
Graph for acidic, basic and amphoteric nature of oxides
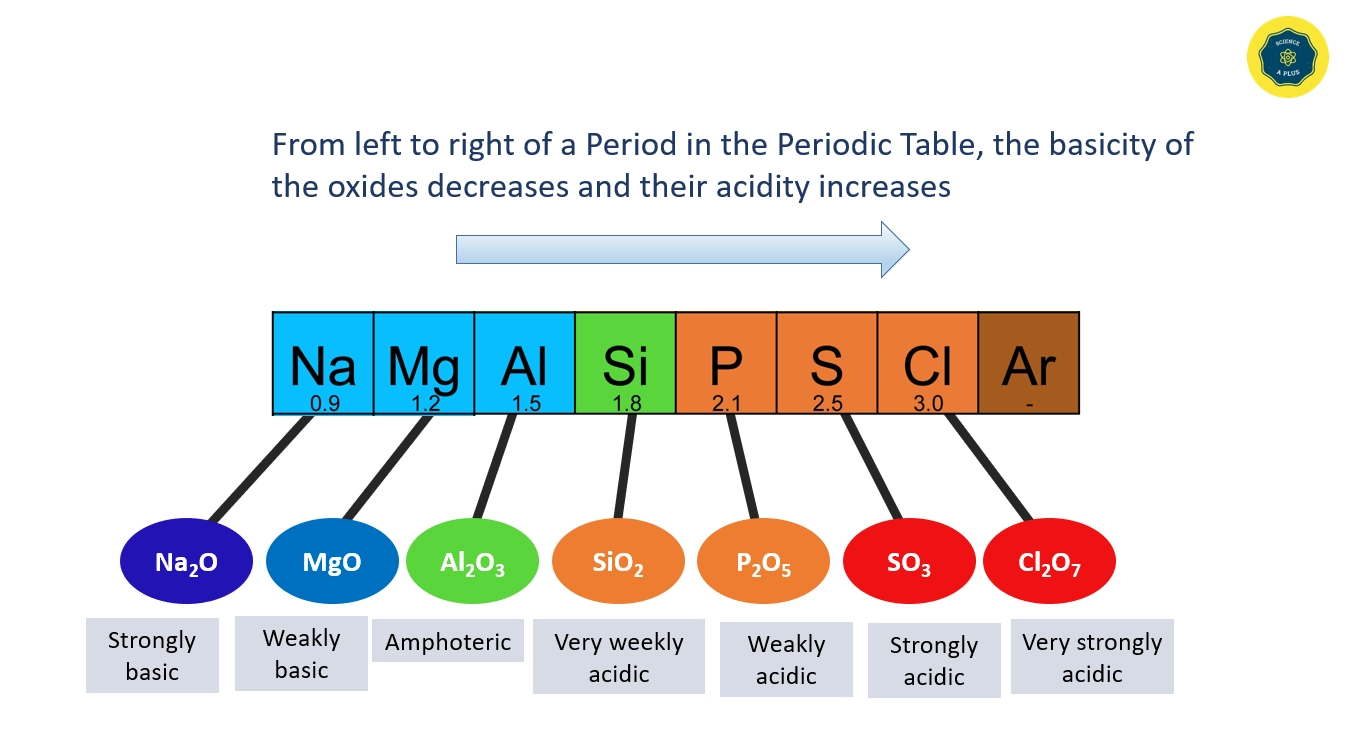
Oxides of the Period 3 elements
The diagram above as text. Reading from sodium across to chlorine, the electronegativity rises and the oxides change from strongly basic, through amphoteric, to very strongly acidic.
| Element | Electronegativity | Oxide | Nature of the oxide |
|---|---|---|---|
| Na | 0.9 | Na2O | Strongly basic |
| Mg | 1.2 | MgO | Weakly basic |
| Al | 1.5 | Al2O3 | Amphoteric |
| Si | 1.8 | SiO2 | Very weakly acidic |
| P | 2.1 | P2O5 | Weakly acidic |
| S | 2.5 | SO3 | Strongly acidic |
| Cl | 3.0 | Cl2O7 | Very strongly acidic |
| Ar | – | – | – |