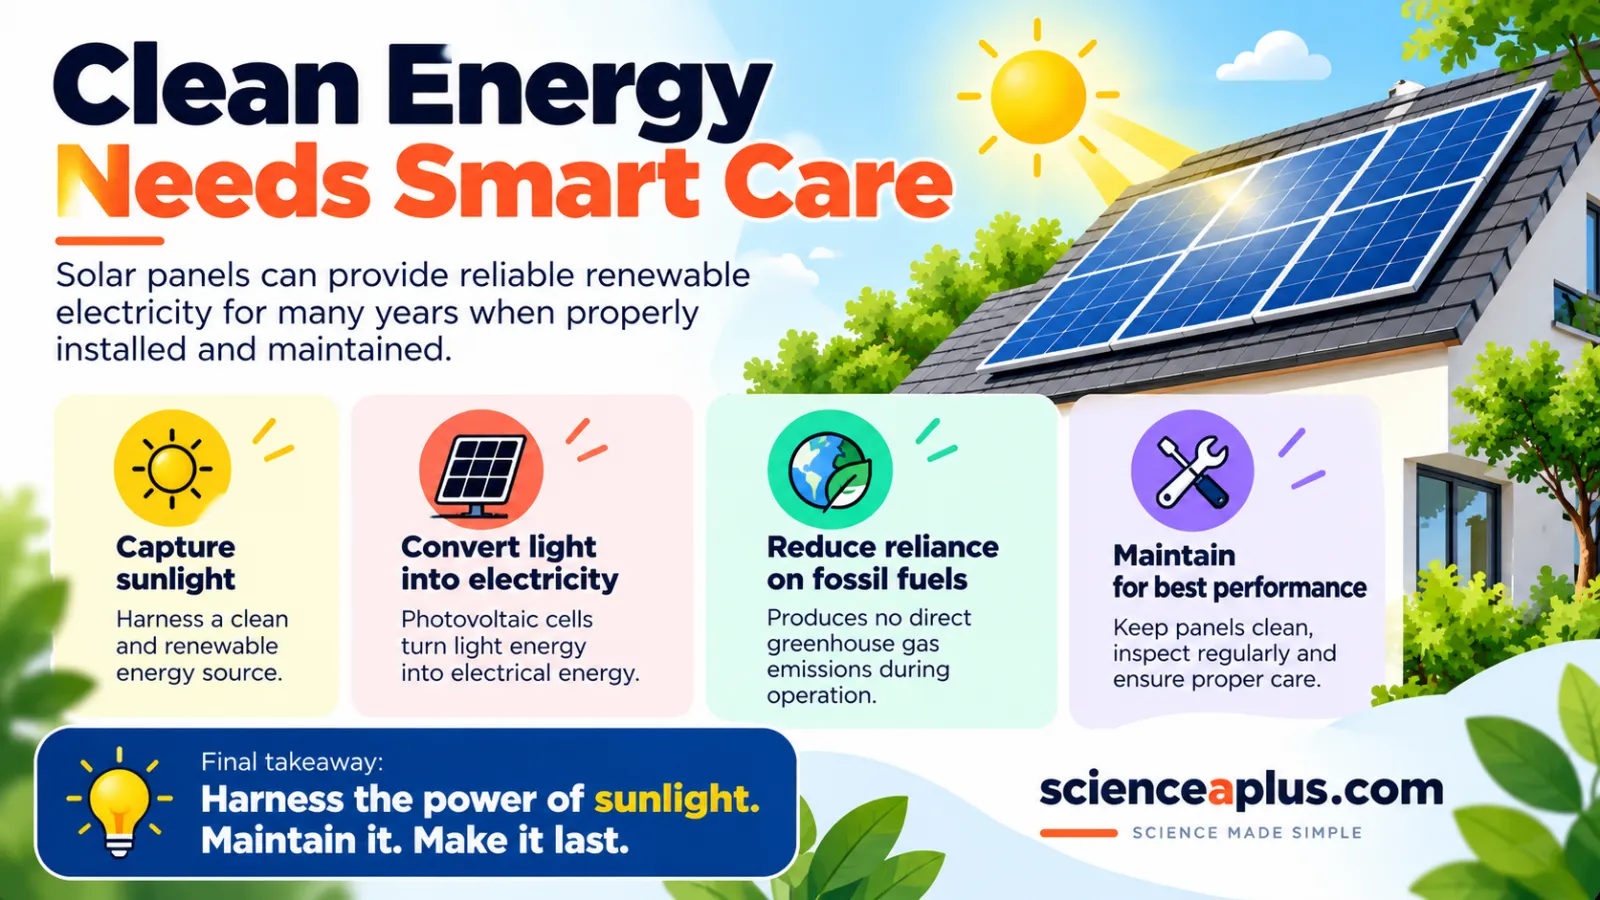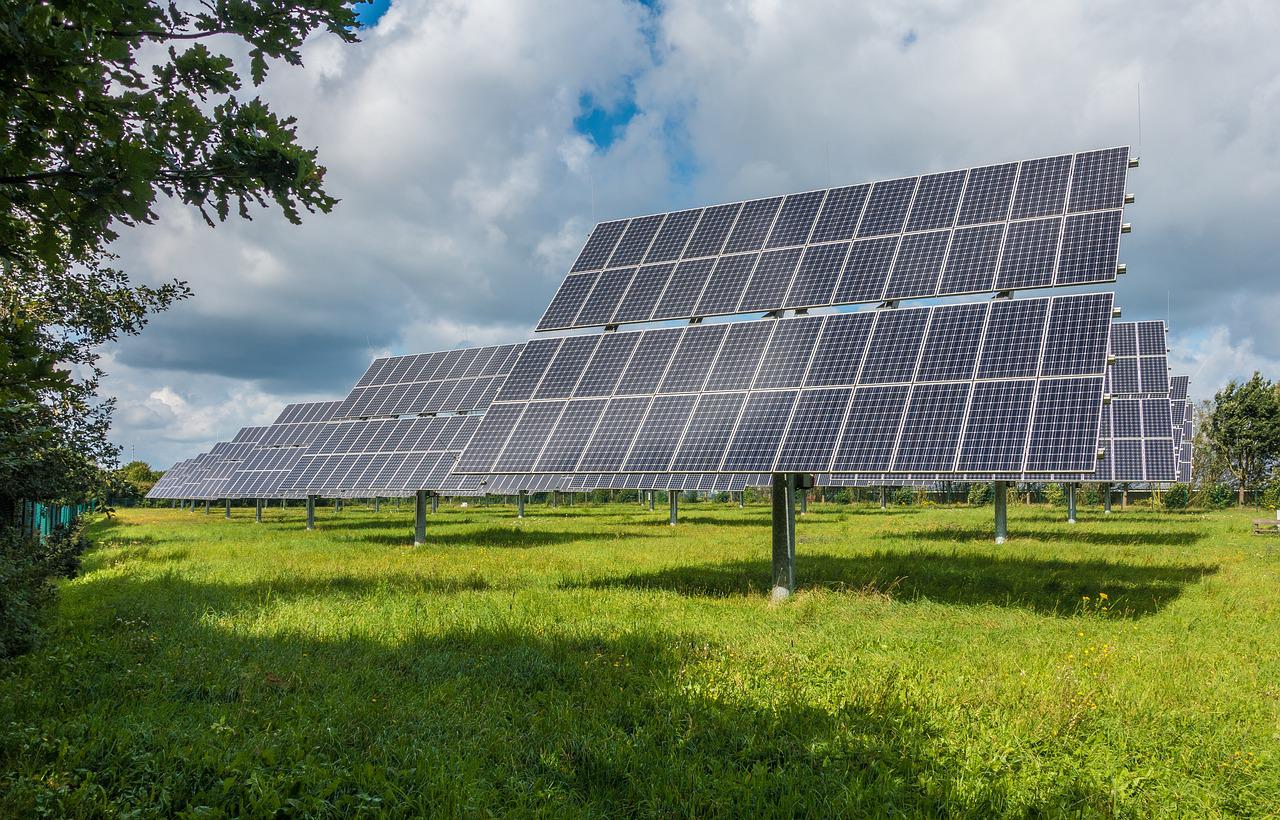
Renewable energy expectations vs reality: renewables now make about half of the UK's electricity (52.1% in 2025) and a third of the world's (33.8%), and new wind and solar are usually the cheapest power to build. But a free fuel does not make a free system, the wind and sun vary, and every piece of equipment has an environmental footprint.
Plenty of websites either cheer for renewables or attack them using old numbers. This article does neither. It takes five big expectations about renewable energy, tests each one against 2025 and 2026 data from the UK government, the International Renewable Energy Agency (IRENA), the energy think tank Ember and the IPCC, and then looks at what a working clean-power system really needs. It suits GCSE students and anyone who wants the facts behind the headlines.
What is renewable energy?
The United Nations describes renewable energy as energy from natural sources that are replenished at a higher rate than they are consumed. Sunlight and wind are the classic examples. Fossil fuels are the opposite: coal, oil and gas are non-renewable resources that take hundreds of millions of years to form, so once we burn them they are effectively gone.
For GCSE Physics, the renewable energy resources you need to know are wind, solar, hydroelectricity, tides, waves, geothermal and bio-fuel. You are expected to compare them for reliability and environmental impact, which is exactly what the rest of this article does. For a wider tour of every energy resource, see our guide to energy sources and their uses.
One word of warning: renewable does not mean zero-carbon. Burning biomass releases carbon dioxide, and building any solar panel, turbine or battery uses energy and materials. We return to that in the section on environmental impact.
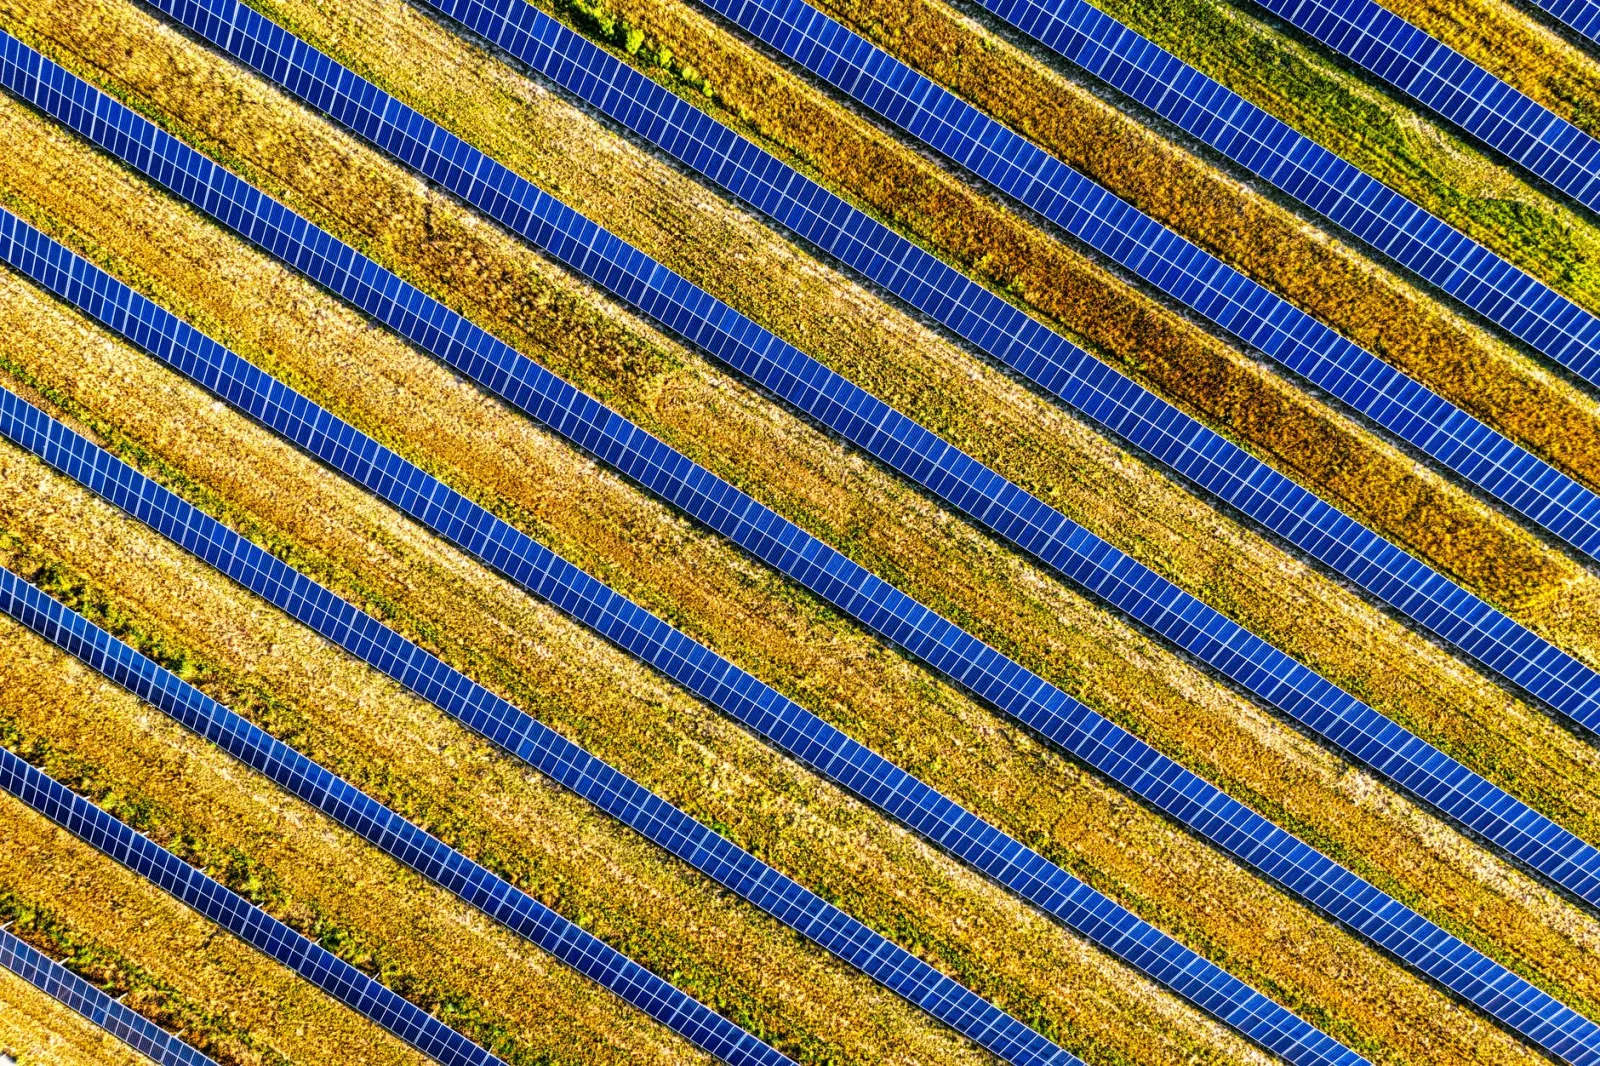
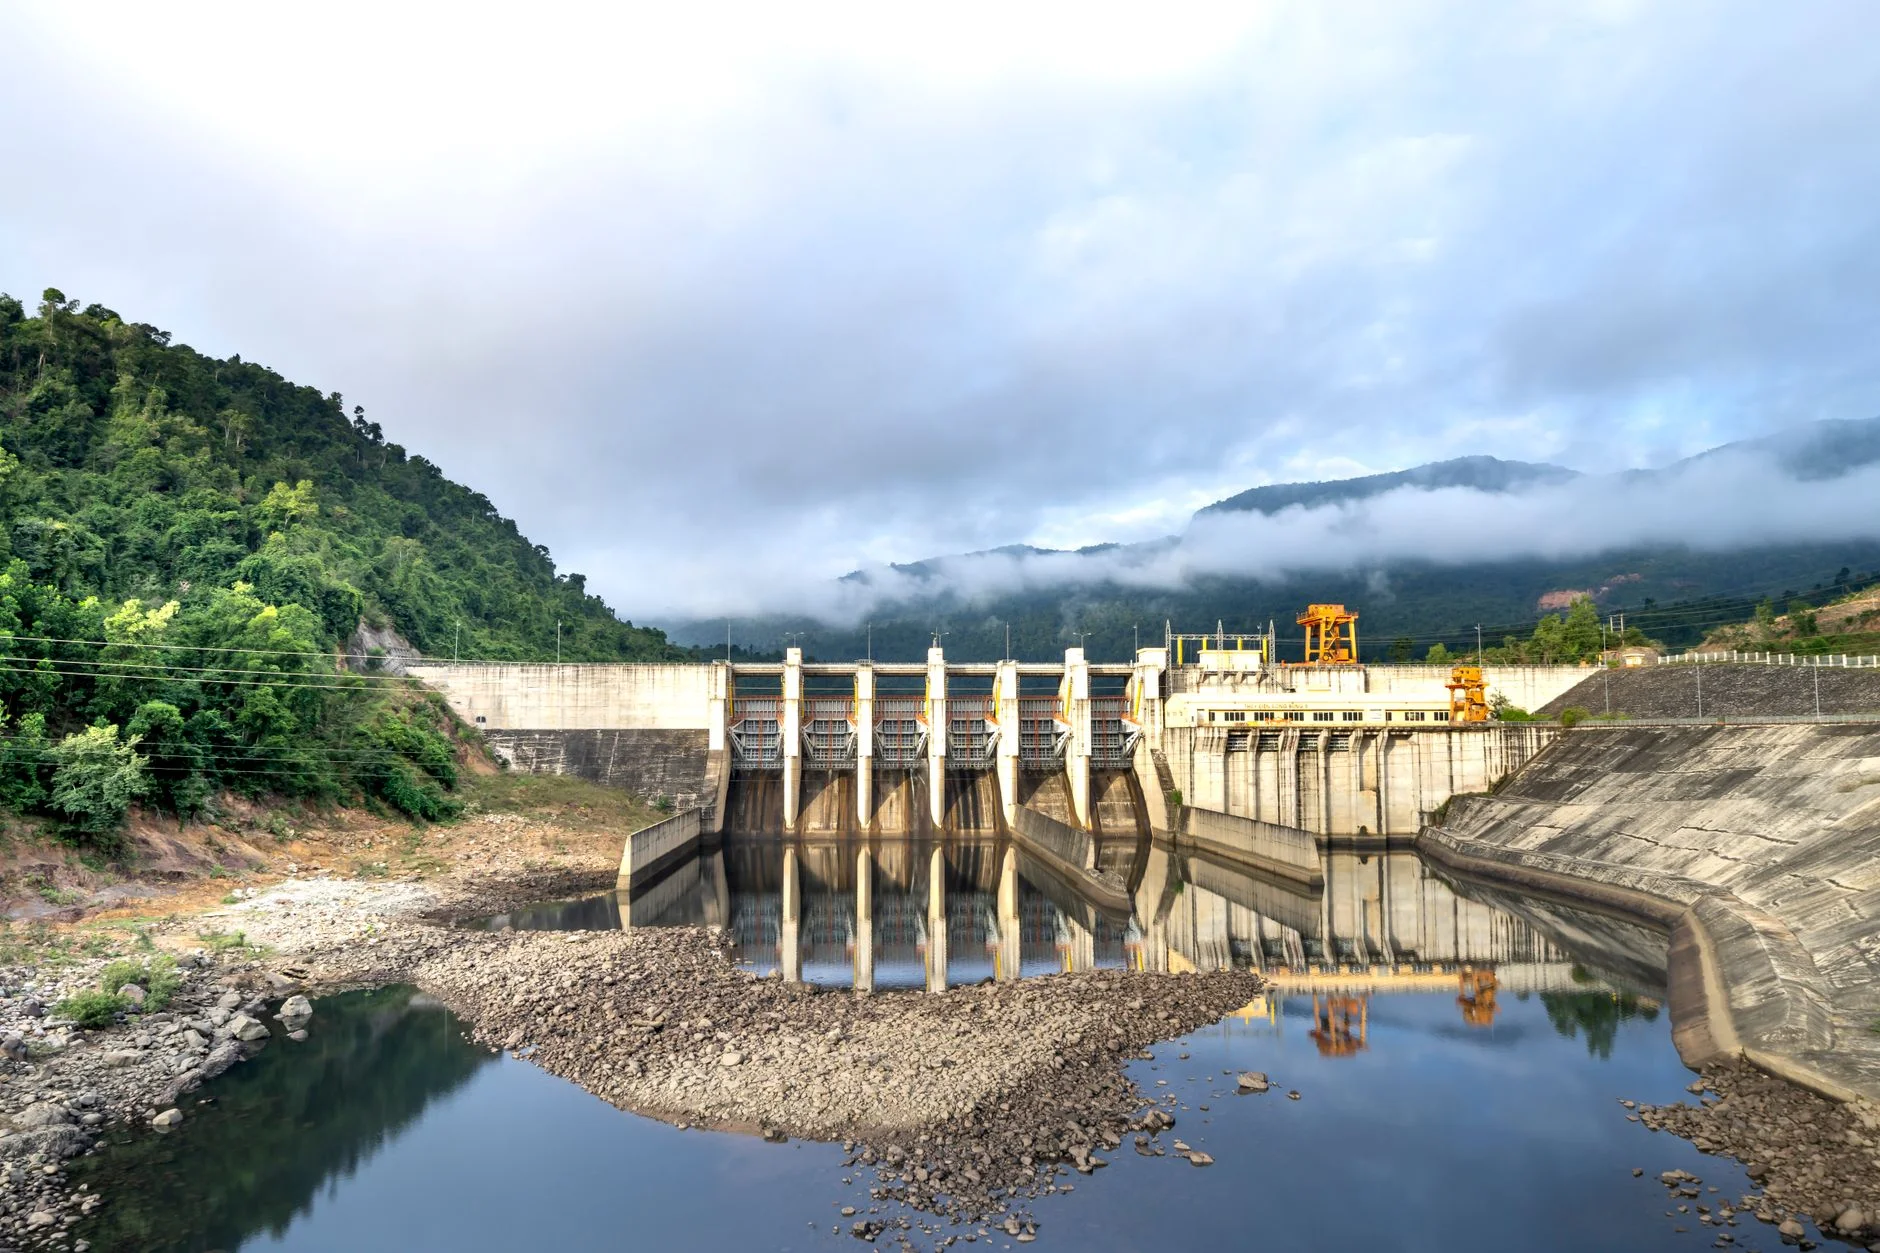
Renewable energy expectations vs reality at a glance
Here are the five expectations we test in this article, with the short answer to each. The detail and the sources follow in the sections below.
| Expectation | Reality | Key evidence |
|---|---|---|
| "Renewables already power most of the country" | Half of UK electricity, but only about a sixth of all the energy we use | 52.1% of electricity vs 16.8% of all energy (DUKES 2026) |
| "Sun and wind are free, so electricity will be free" | Cheapest new power to build, but equipment, grids and backup all cost money | Onshore wind USD 33/MWh, solar USD 44/MWh; over 90% of new projects beat new fossil fuels (IRENA) |
| "Renewables have no environmental impact" | Very low life-cycle carbon, but mining, land use and recycling matter | 11–48 g CO₂eq/kWh for wind and solar vs 820 g for coal (IPCC) |
| "Clean power will quickly fix climate change" | Fossil power generation has stopped growing, but total fossil CO₂ was projected to hit a record | Fossil generation −0.2% (Ember); 38.1 billion tonnes of CO₂ (Global Carbon Budget) |
| "Renewables can supply power whenever we need it" | Output follows the weather, so storage, grids and backup fill the gaps | UK load factors of 11.1% to 36.4% for solar and wind (DUKES 2026) |
Expectation 1: "Renewables already power the country"
The expectation is that renewable energy is a small add-on to a fossil-fuel system. The reality for electricity is very different. According to the government's Digest of UK Energy Statistics (DUKES 2026), the UK generated a record 153.0 TWh of renewable electricity in 2025, up 5.9% on 2024. That was 52.1% of all UK electricity generation. 2024 was the first year renewables passed the halfway mark.
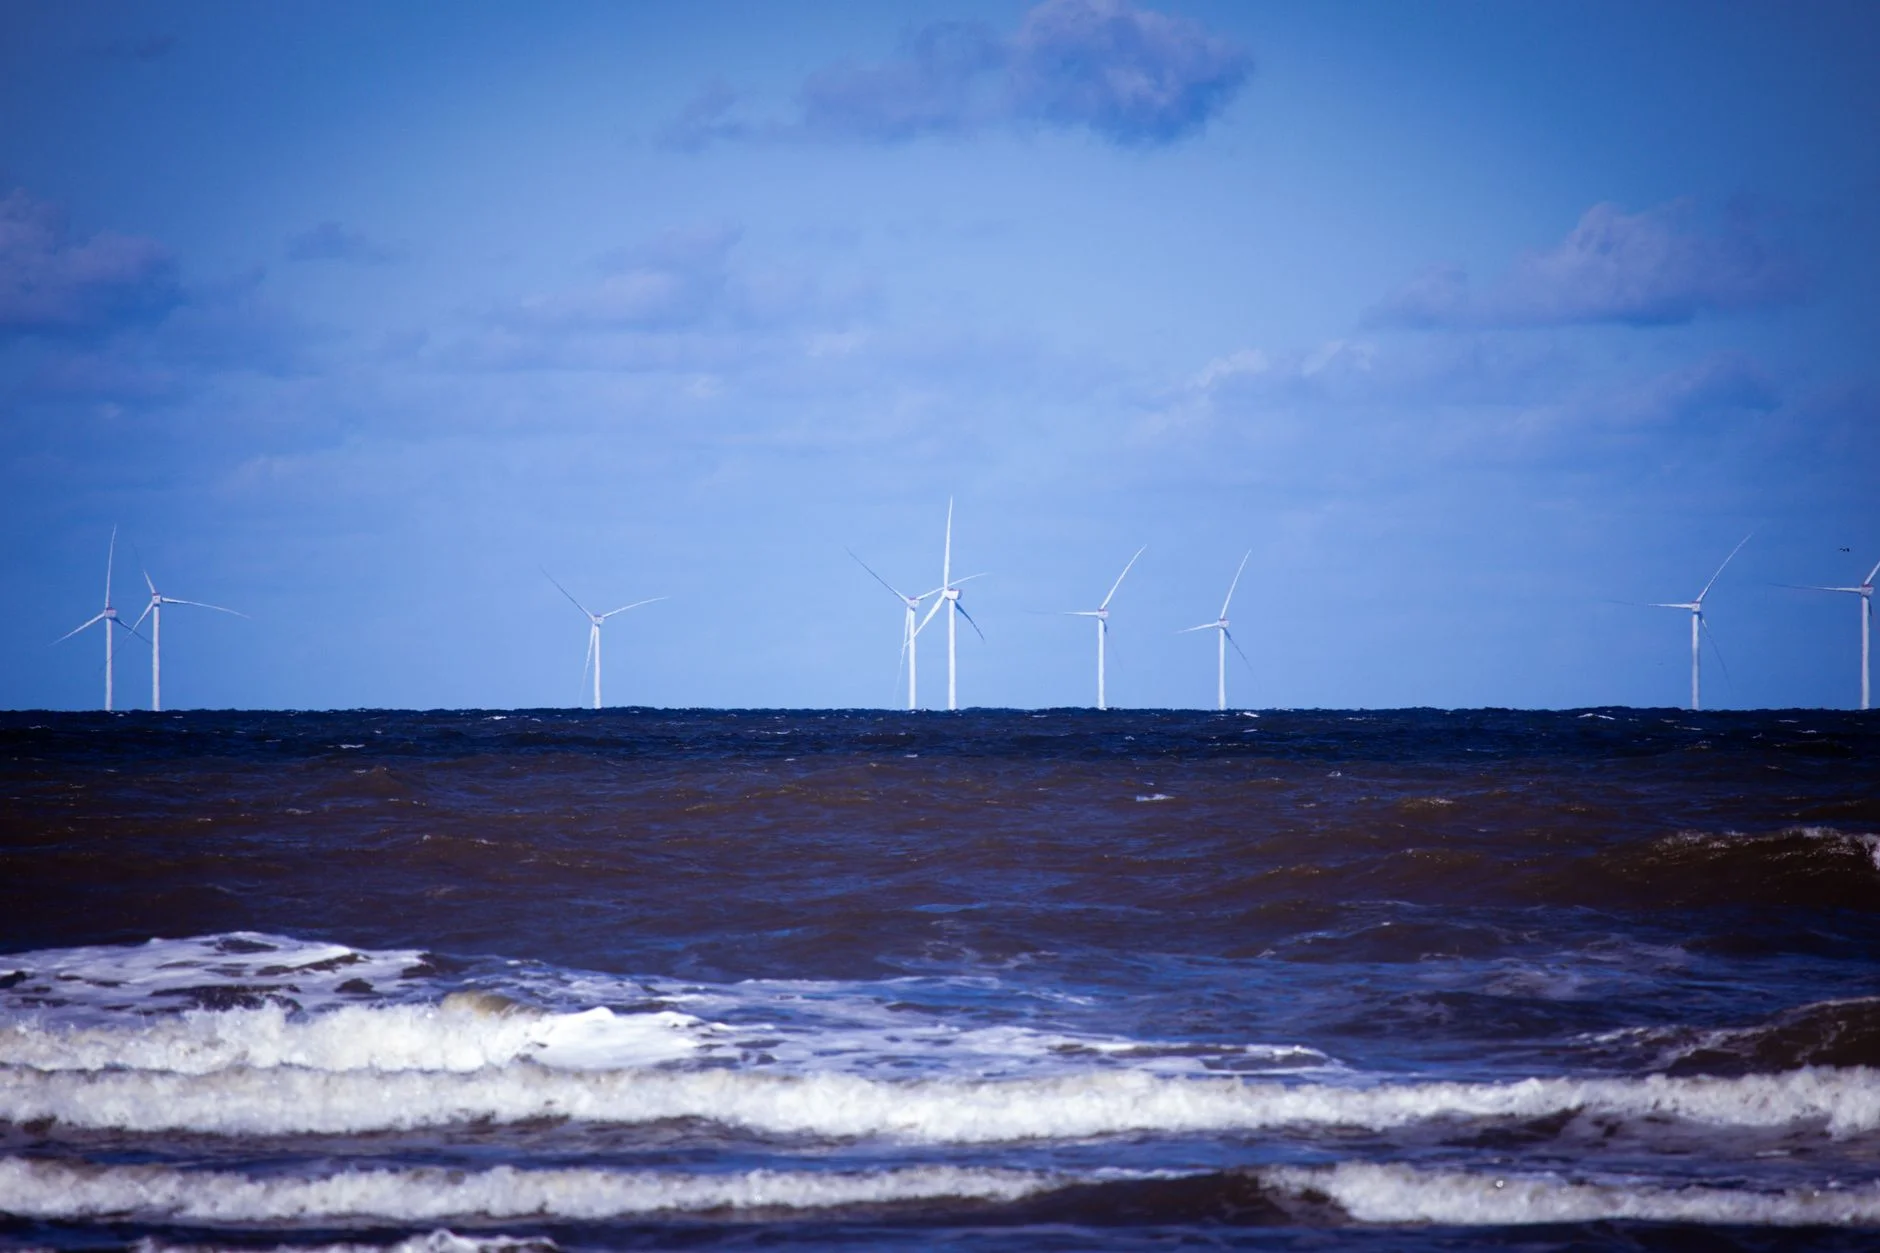
Offshore wind did the heavy lifting. It produced a record 52.0 TWh, about three times its 2015 output, and for the first time offshore wind capacity overtook onshore wind capacity. Solar PV also set a record at 20.1 TWh, up 34%, helped by 2025 having the highest average sunshine hours in the DUKES series, which began in 2001. Onshore wind made 34.4 TWh, slightly down because of lower wind speeds, and hydro made 5.4 TWh, down 6% in a drier year.
The symbolic end of the old system came on 30 September 2024, when Ratcliffe-on-Soar, the UK's last coal-fired power station, closed. It ended 142 years of coal power in Britain, which began with a plant in London in 1882, and made the UK the first G7 country to stop burning coal for electricity.
The picture is similar around the world. Ember's Global Electricity Review 2026 found that renewables supplied 33.8% of the world's electricity in 2025, rising above a third for the first time and overtaking coal, which fell to 33.0%. Solar alone met 75% of the growth in global electricity demand, and solar and wind together met 99% of it.
The twist: electricity is not all our energy
Now the catch. Electricity is only one part of how we use energy. Most homes are heated by gas boilers, and most cars, lorries and planes run on petrol, diesel or jet fuel. When you count all energy, the picture changes sharply. DUKES 2026 puts renewables at just 16.8% of UK gross final energy consumption in 2025. Broken down, that is 53.5% for electricity, 10.1% for heat and 6.1% for transport.
This gap matters for climate action. Cutting emissions from electricity is the easy part, because wind and solar can already compete on price. The harder job is switching heating and transport away from fossil fuels, which is why heat pumps and electric vehicles keep appearing in climate plans. Our article on the climate crisis, greenhouse gases and the greenhouse effect explains why those emissions matter.
Expectation 2: "Renewable energy is free"
The expectation goes like this: sunlight and wind cost nothing, so electricity from them should cost nothing too. Half of that is true. The fuel really is free, which is a huge advantage over coal, gas or uranium that must be mined, bought and delivered every day. But the equipment that catches the wind and sunlight is not free. Someone has to manufacture it, install it, maintain it and eventually replace it.
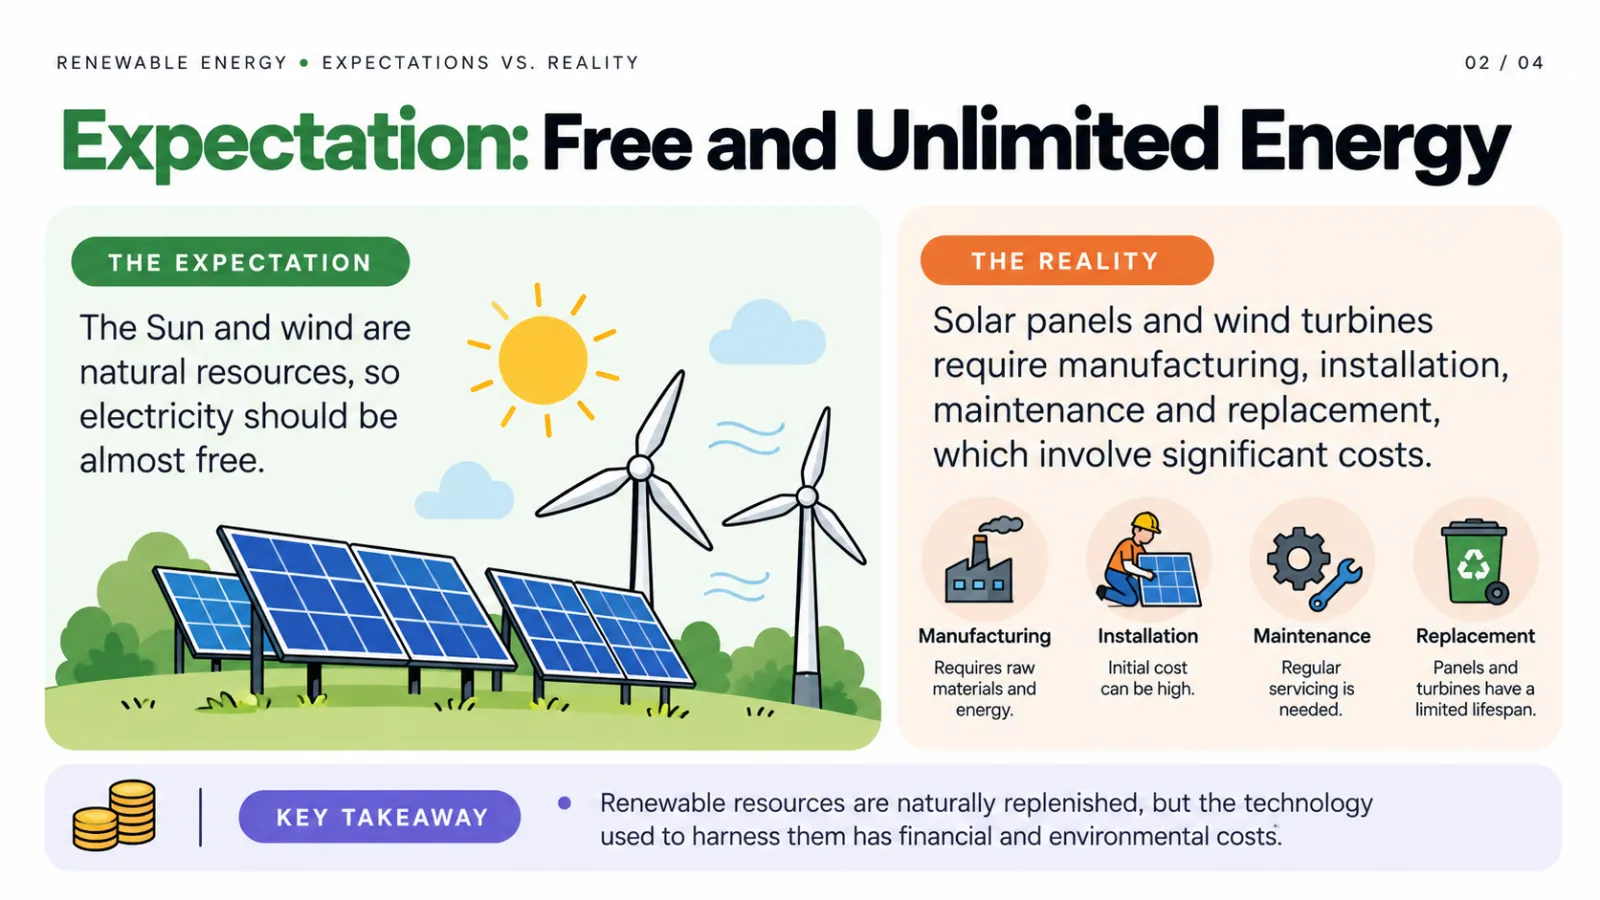
Engineers compare the cost of different power sources using the levelised cost of electricity (LCOE). In plain terms, it is the average cost of each unit of electricity over a power plant's lifetime: the cost of building it, running it and financing it, divided by everything it will generate.
On that measure, renewables have become remarkably cheap. IRENA's report on renewable power generation costs in 2025 (published July 2026) gives global weighted-average LCOE figures of:
- Onshore wind: USD 33 per MWh, the cheapest new source of electricity
- Solar PV: USD 44 per MWh, unchanged from 2024
- Offshore wind: USD 78 per MWh
More than 90% of the new utility-scale renewable capacity added in 2025 produced power more cheaply than the cheapest new fossil-fuel alternative. Since 2010, the cost of electricity from solar PV has fallen by 89%, onshore wind by 71% and offshore wind by 63%. IRENA estimates that renewables avoided around USD 480 billion of fossil fuel costs in 2025.
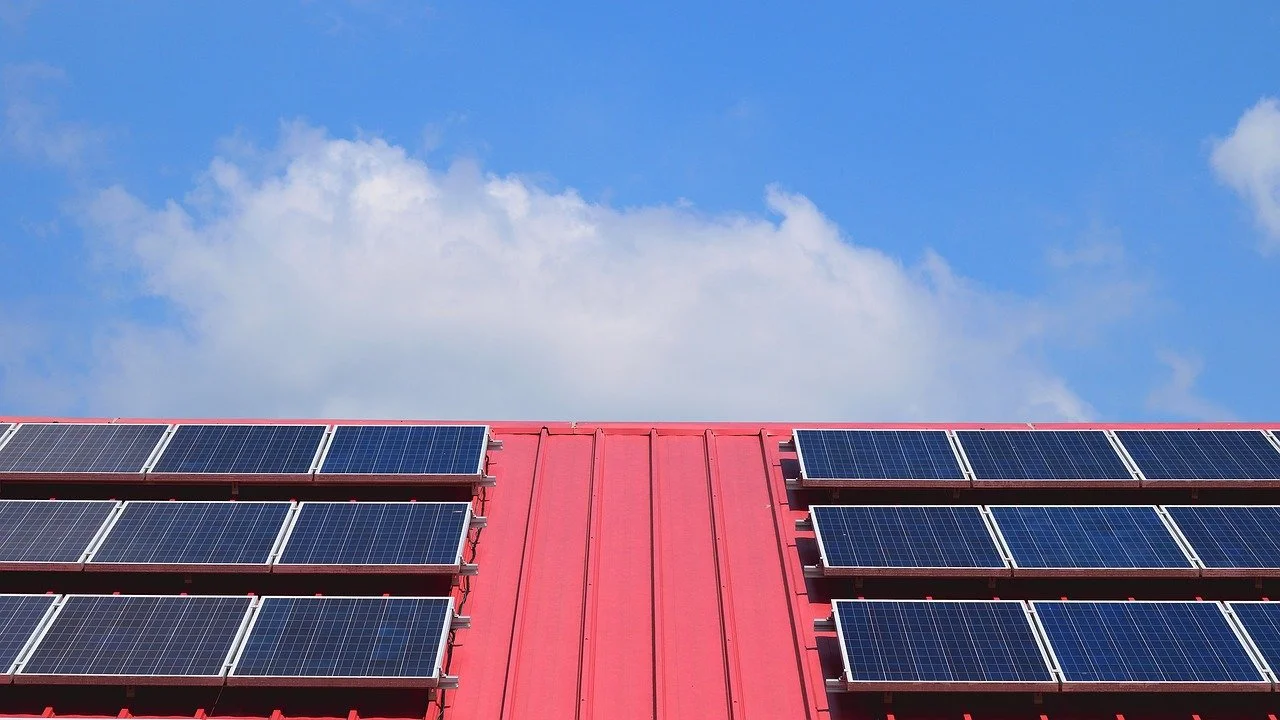
From a 6% laboratory cell to a 99% price drop
The first practical silicon solar cell was demonstrated at Bell Labs on 25 April 1954 and converted about 6% of sunlight into electricity. It was a curiosity. Data compiled by Our World in Data from IRENA and other sources show how far prices have fallen since: a solar module cost about $132 per watt in 1975 and about $0.27 per watt in 2024, in constant 2025 US dollars. That is a fall of more than 99%. If you want to know how the cells themselves turn light into current, read our explainer on how solar panels work.
The reality check on cost
The cost story is not a simple one-way slide, though. IRENA notes that costs are now stabilising after a decade of steep falls, and that dispatchable renewables, which can be switched on when needed, got more expensive in 2025: hydro rose to USD 62 per MWh, geothermal to USD 89 and concentrated solar power to USD 115. New gas also became dearer because a shortage of gas turbines roughly doubled the build cost of new combined-cycle plants in the United States, pushing gas towards USD 100 per MWh in Italy, Germany and Japan.
And cheap generation is only part of the system. Power lines, balancing the grid and backup capacity all add costs that LCOE does not show. We cover those in the section on the smarter energy system below. For the household view of installing panels, see our pros and cons of solar energy.
Capacity vs real output: the load factor
Here is one of the most important ideas for judging any renewable energy headline. A wind farm with a capacity of 1,000 megawatts (MW) is able to produce 1,000 MW when the wind is ideal. It will not do that all year. The fraction of its maximum possible output that a power plant actually delivers over a period is called its load factor, also known as the capacity factor.
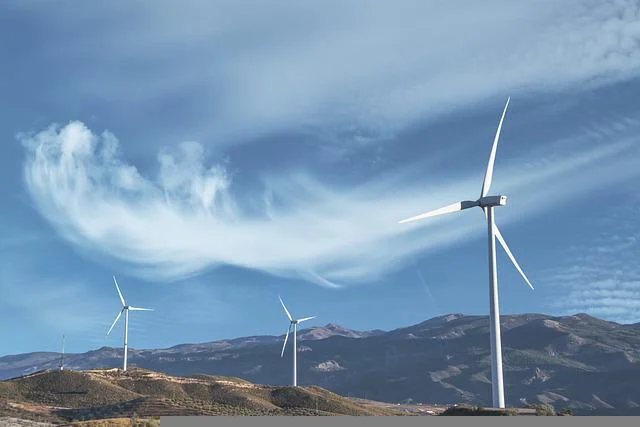
A year has 8,760 hours (365 × 24), so the yearly energy output is:
energy (MWh) = capacity (MW) × 8,760 h × load factor
The government's DUKES 2026 publication gives these UK load factors for 2025:
| Technology | UK load factor, 2025 |
|---|---|
| Offshore wind | 36.4% |
| Onshore wind | 24.1% (25.0% in 2024) |
| Solar PV | 11.1% (9.2% in 2024) |
| Bioenergy | 63% |
Why are the numbers so different? Offshore turbines meet stronger, steadier sea winds, and the newer ones are larger. Onshore turbines sit where the wind is weaker and more variable. UK solar panels have a low load factor because the Sun is down at night, low in winter and often hidden by cloud. Notice that solar's 11.1% came in the sunniest year of the DUKES series (since 2001). Bioenergy plants burn fuel, so they can run almost continuously, which is why their load factor is much higher.
What a load factor means in practice
Take 1,000 MW of capacity. Offshore wind at 36.4% generates 1,000 × 8,760 × 0.364 = 3,188,640 MWh a year, about 3.19 TWh. That is roughly enough for 1.28 million homes using 2,500 kWh each. The same 1,000 MW of solar at 11.1% generates about 972 GWh, enough for around 389,000 homes. Same capacity, but offshore wind produces about 3.3 times as much energy in the UK.
Be careful with the phrase "enough to power X homes". It is a yearly average. It does not mean the electricity arrives at the moment each home needs it. Try the numbers yourself below. We use 2,500 kWh a year because that is the "typical" medium-sized household electricity use in Ofgem's 2026 price cap calculations. For more on turbine strengths and weaknesses, see advantages and disadvantages of wind energy.
A 500 MW solar farm and a 500 MW offshore wind farm are built in the UK. Using 2025 load factors, which generates more electricity in a year, and roughly how many times more? (3 marks)
Solar: 500 × 8,760 × 0.111 = 486,180 MWh. Offshore wind: 500 × 8,760 × 0.364 = 1,594,320 MWh. The offshore wind farm generates more, roughly 3.3 times as much.
Expectation 3: "Renewable energy has no environmental impact"
Wind and solar farms burn nothing, so it is easy to assume they are impact-free. The reality is that every energy technology has a footprint. To compare them fairly, scientists look at the whole life cycle: mining raw materials, manufacturing, transport and installation, years of operation, and finally dismantling and recycling or disposal.
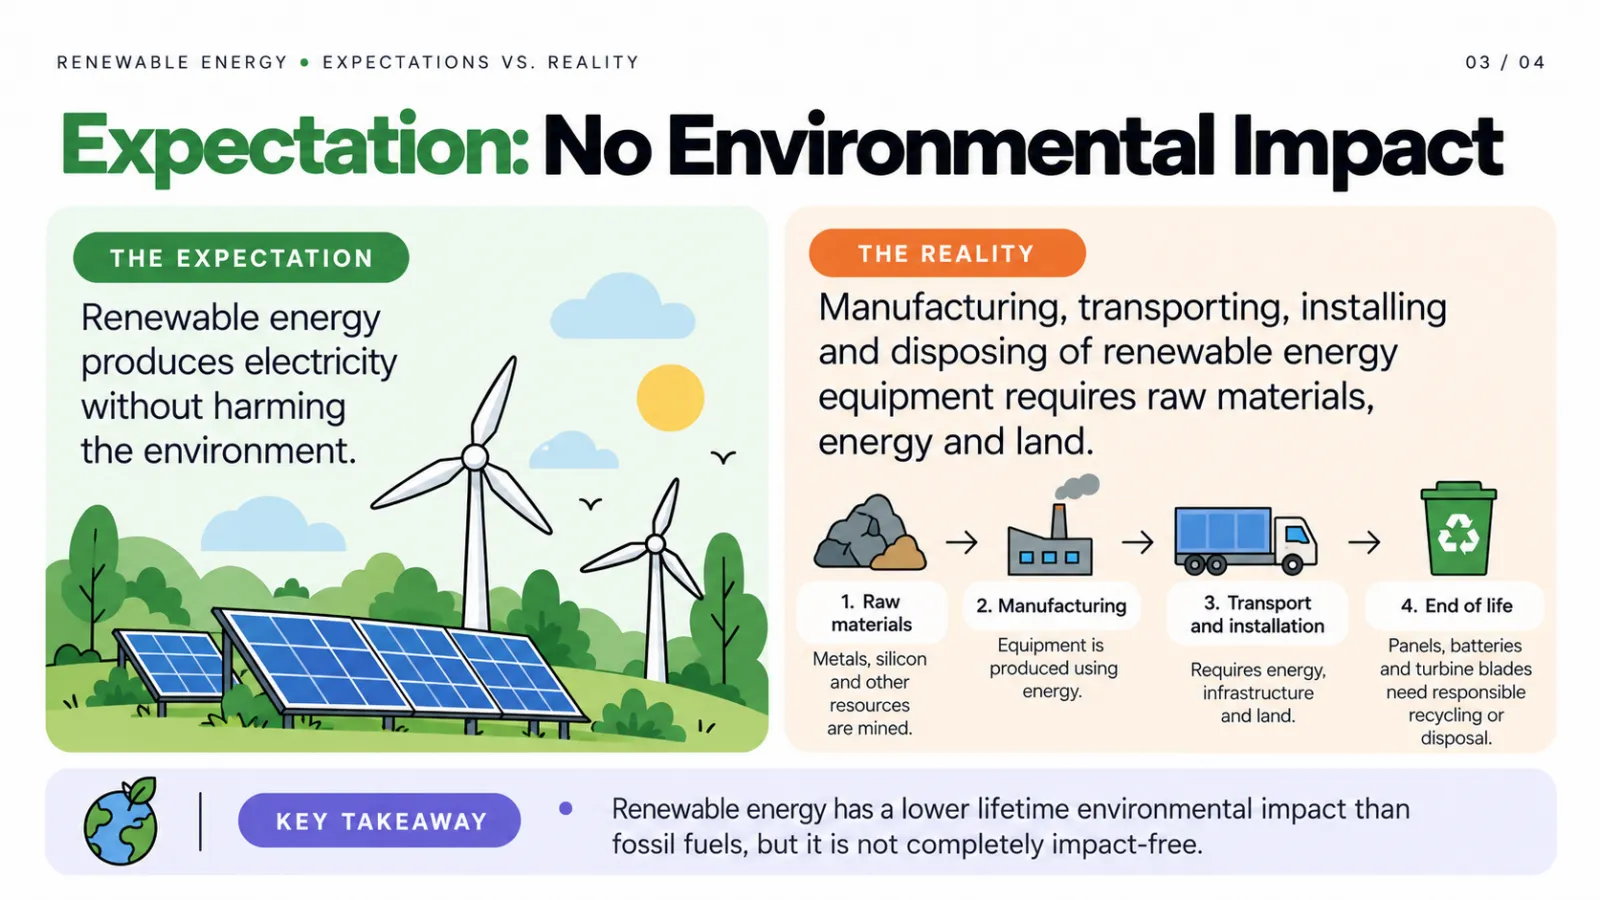
Life-cycle carbon: the numbers
The IPCC's Fifth Assessment Report assessed the whole-life greenhouse gas emissions of different electricity sources. Its median values, in grams of carbon dioxide equivalent per kilowatt-hour of electricity (gCO₂eq/kWh), include the emissions from building the equipment as well as running it:
| Source | Median life-cycle emissions (gCO₂eq/kWh) |
|---|---|
| Coal (pulverised) | 820 |
| Gas (combined cycle) | 490 |
| Biomass (dedicated crops) | 230 |
| Solar PV (utility scale) | 48 |
| Solar PV (rooftop) | 41 |
| Hydro | 24 |
| Nuclear | 12 |
| Offshore wind | 12 |
| Onshore wind | 11 |
Onshore wind comes out about 75 times lower than coal, and utility solar about 17 times lower. That is low, not zero. The IPCC data date from 2014, so we call them the IPCC figures rather than today's exact values. Hydro deserves a note too: its range is enormous, from 1 to 2,200 gCO₂eq/kWh, because some reservoirs give off methane.
Metals, mining and end of life
Renewable technologies are built from materials that must be dug out of the ground. Panels need silicon, aluminium and glass, plus small amounts of other metals. Turbines need large amounts of steel and copper, and some designs use rare-earth magnets. Batteries, which we meet again later, rely on lithium.
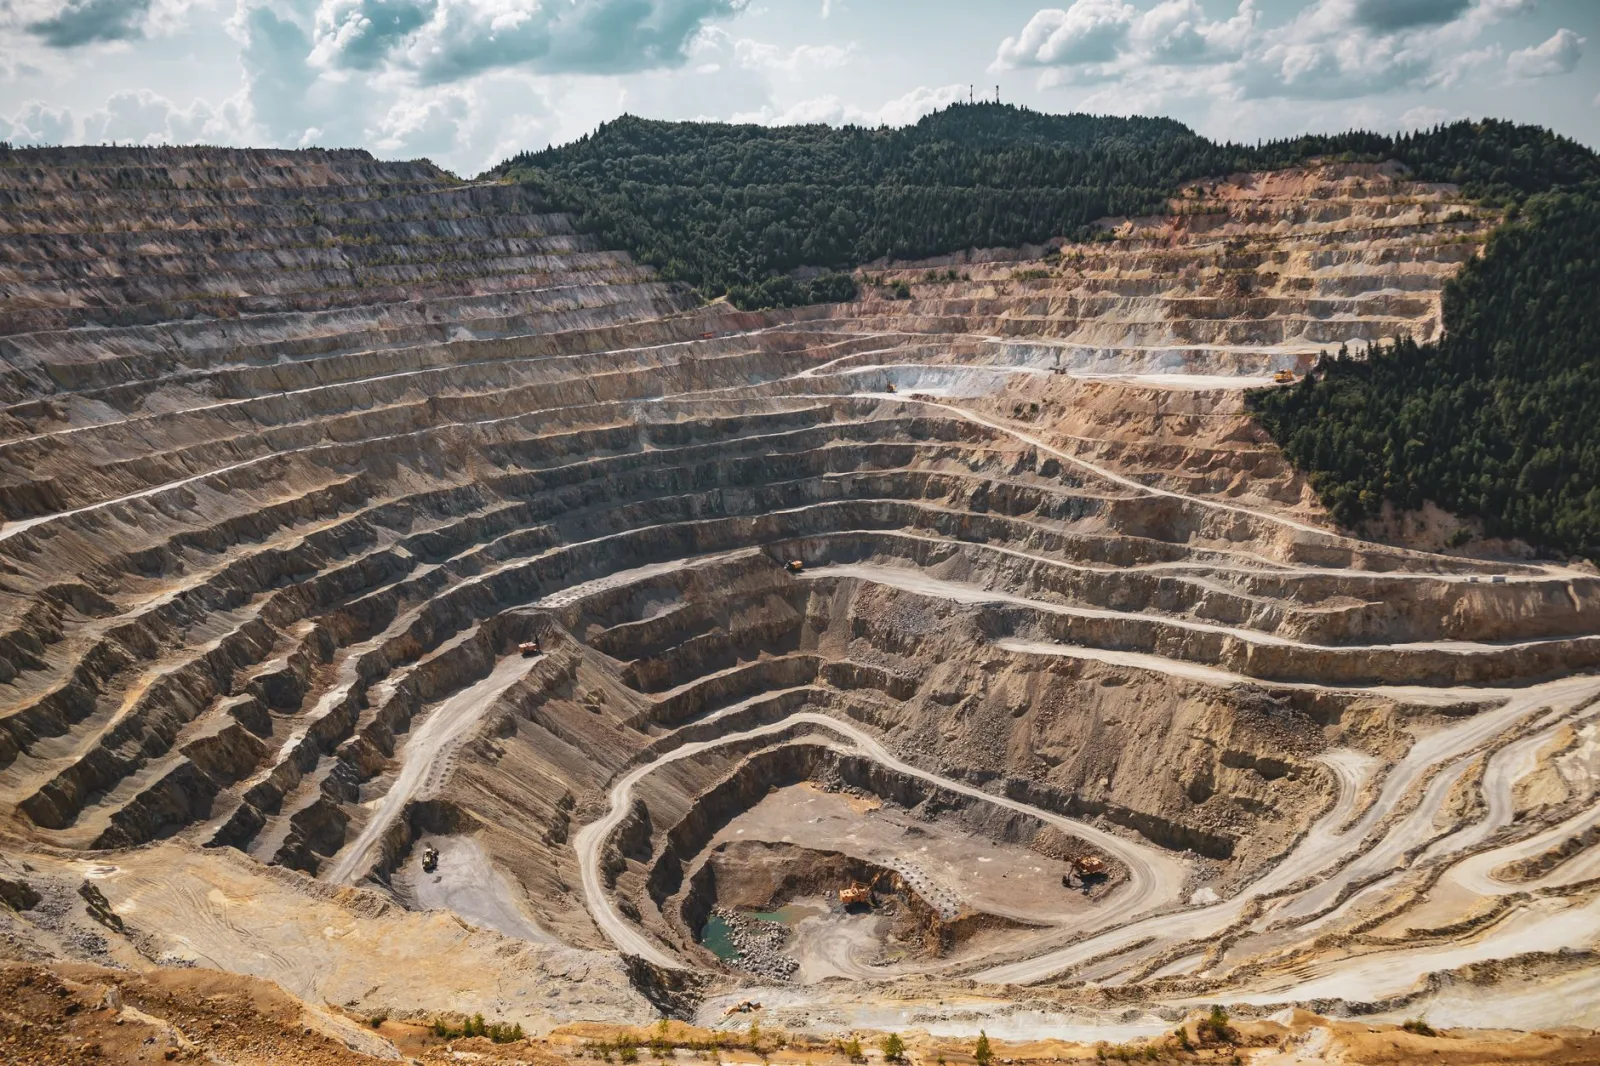
The US Geological Survey's Mineral Commodity Summaries 2026 shows how fast this is moving. Batteries now account for 88% of global lithium use. World lithium production (excluding the United States) was about 290,000 tonnes in 2025, up 31% on 2024. Known resources are far larger, about 150 million tonnes worldwide, so the issue is less about running out and more about how mining is done. Prices are also volatile: battery-grade lithium carbonate in the US averaged around $63,700 per tonne in 2022 but only about $9,000 per tonne in 2025.
Mining uses land, water and energy, and it can affect the communities nearby. Lithium comes from hard rock in Australia and from underground brines in Chile and Argentina, and China is also a major producer. To understand the element itself, read about lithium and its chemical properties.
What happens when equipment wears out? In the UK, solar panels are covered by the Waste Electrical and Electronic Equipment (WEEE) Regulations 2013, which make producers pay for collection and recycling. Wind turbine blades are harder to deal with because they are made of composite materials, glass or carbon fibre set in resin, which are difficult to separate. Recycling processes for all of these are improving, and recovering metals reduces the need for new mining. Our article is recycling metal important? explains why.
Birds, bats and land
Wildlife is a common concern. The US Fish and Wildlife Service publishes median annual estimates for the main human-related causes of bird deaths in the United States, as of 2017:
- Cats: about 2.4 billion
- Collisions with building glass: about 599 million
- Vehicles: about 214.5 million
- Power-line collisions: about 25.5 million
- Land-based wind turbines: about 234,000 (range 140,000 to 328,000)
So turbines are a very small cause compared with several everyday ones. That does not mean siting does not matter. Wind farms placed on bird migration routes or near sensitive habitats can do real harm, and bats are also affected. Careful planning and environmental surveys before building are part of the answer.
Land is another cost. Solar farms and reservoirs take up space, and dams change the flow of rivers and can block the paths of migrating fish. Habitat loss is a major threat to wildlife everywhere, which is why this matters; see our article on the importance of biodiversity in ecosystems. Putting panels on roofs and already-developed land reduces the pressure.
Expectation 4: "Clean power will quickly fix climate change"
The hope is that as soon as wind and solar scale up, emissions will drop quickly. There is good news: Ember found that global fossil-fuel electricity generation fell very slightly in 2025, by 38 TWh or 0.2%. In the power sector, fossil generation has stopped growing.
The bad news is that the power sector is only one part of the picture. The Global Carbon Budget 2025 projected that global fossil CO₂ emissions would rise by 1.1% in 2025 to a record 38.1 billion tonnes, with coal up 0.8%, oil up 1% and gas up 1.3%. That is a projection rather than a final count. The same analysis estimates the remaining carbon budget for limiting warming to 1.5 °C at about 170 billion tonnes of CO₂, roughly four years at current emission rates.
Why the mismatch? Transport, heating, industry and aviation still run mostly on fossil fuels, and energy demand is growing. Renewable electricity helps most when it replaces fossil fuels rather than just adding to the total.
Biofuels: a cautionary tale
Biofuels show how an apparently simple solution can be complicated. Since September 2021, standard 95-octane petrol in Great Britain has been E10, which contains up to 10% renewable ethanol. The government said this could cut transport CO₂ by about 750,000 tonnes a year. But the crops used to make ethanol need land, which raises a food-versus-fuel debate, and they also need fertiliser, machinery and processing. Biofuels are therefore not automatically carbon-neutral.
The wider transport picture shows how slow the change is. Renewables supplied only 6.1% of UK transport energy in 2025, biofuel demand fell 3.8%, and bio-jet fuel was just 2.1% of aviation fuel demand.
Reality: renewables need a smarter energy system
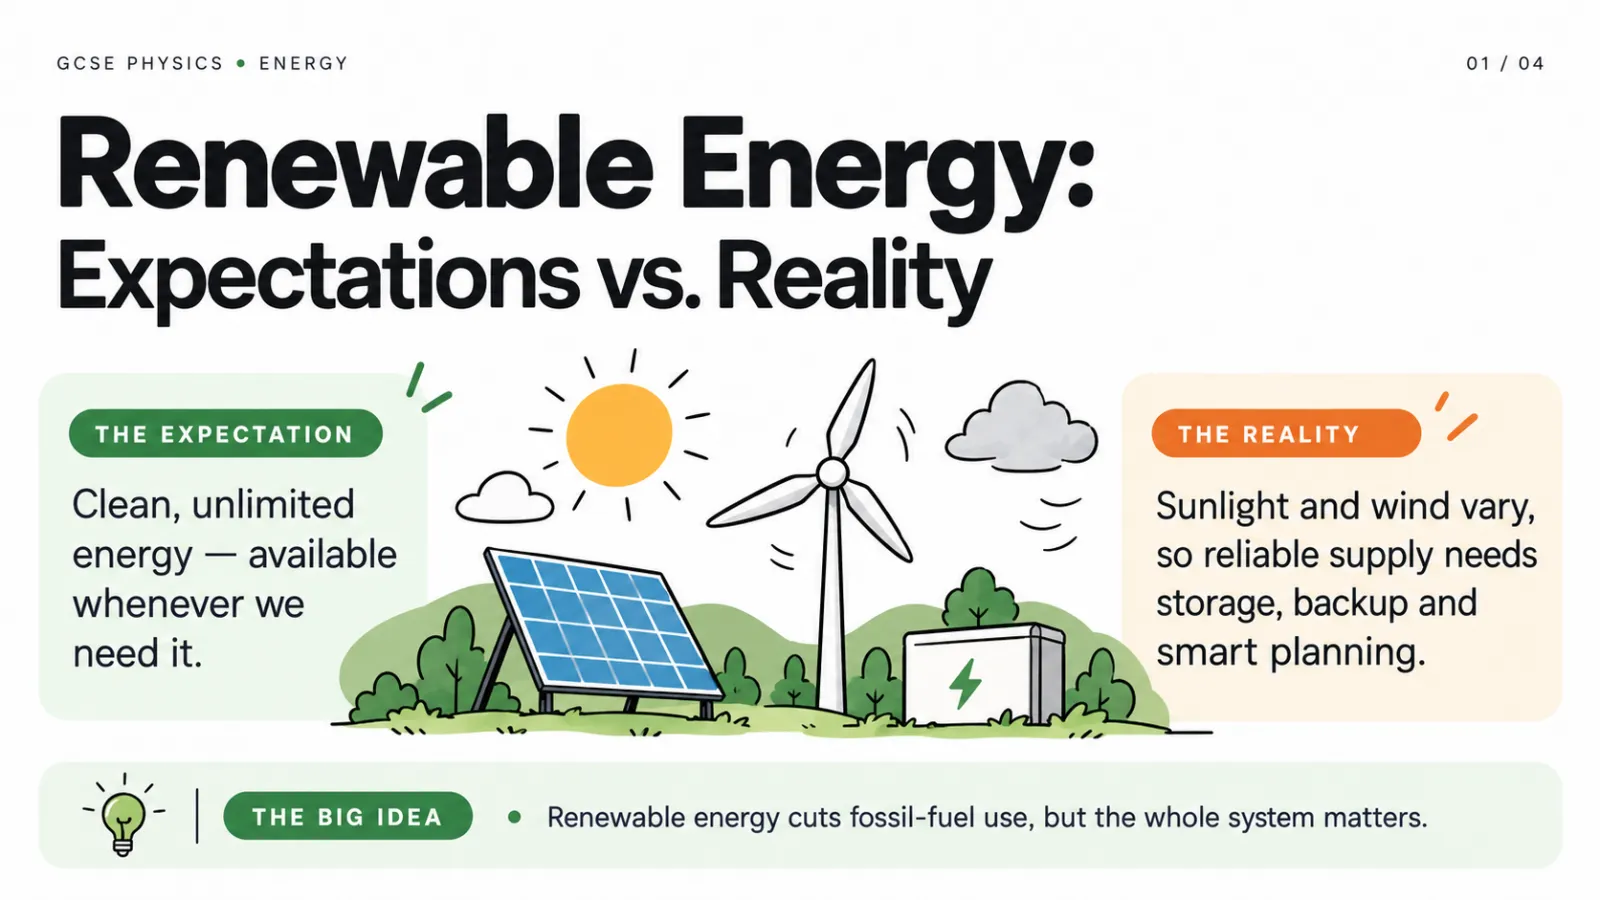
The fifth and final expectation is that renewable energy will supply power whenever we need it. On its own, it will not. Solar panels make nothing at night and less in winter or under cloud. Wind output changes from hour to hour. Occasionally the UK and its neighbours have a long, still, dark and cold spell, which Germans call a Dunkelflaute ("dark doldrums"), when both wind and solar are low for days.
The answer is not to give up on renewables. It is to build a system around them, and the infographic below sums up four of its parts.
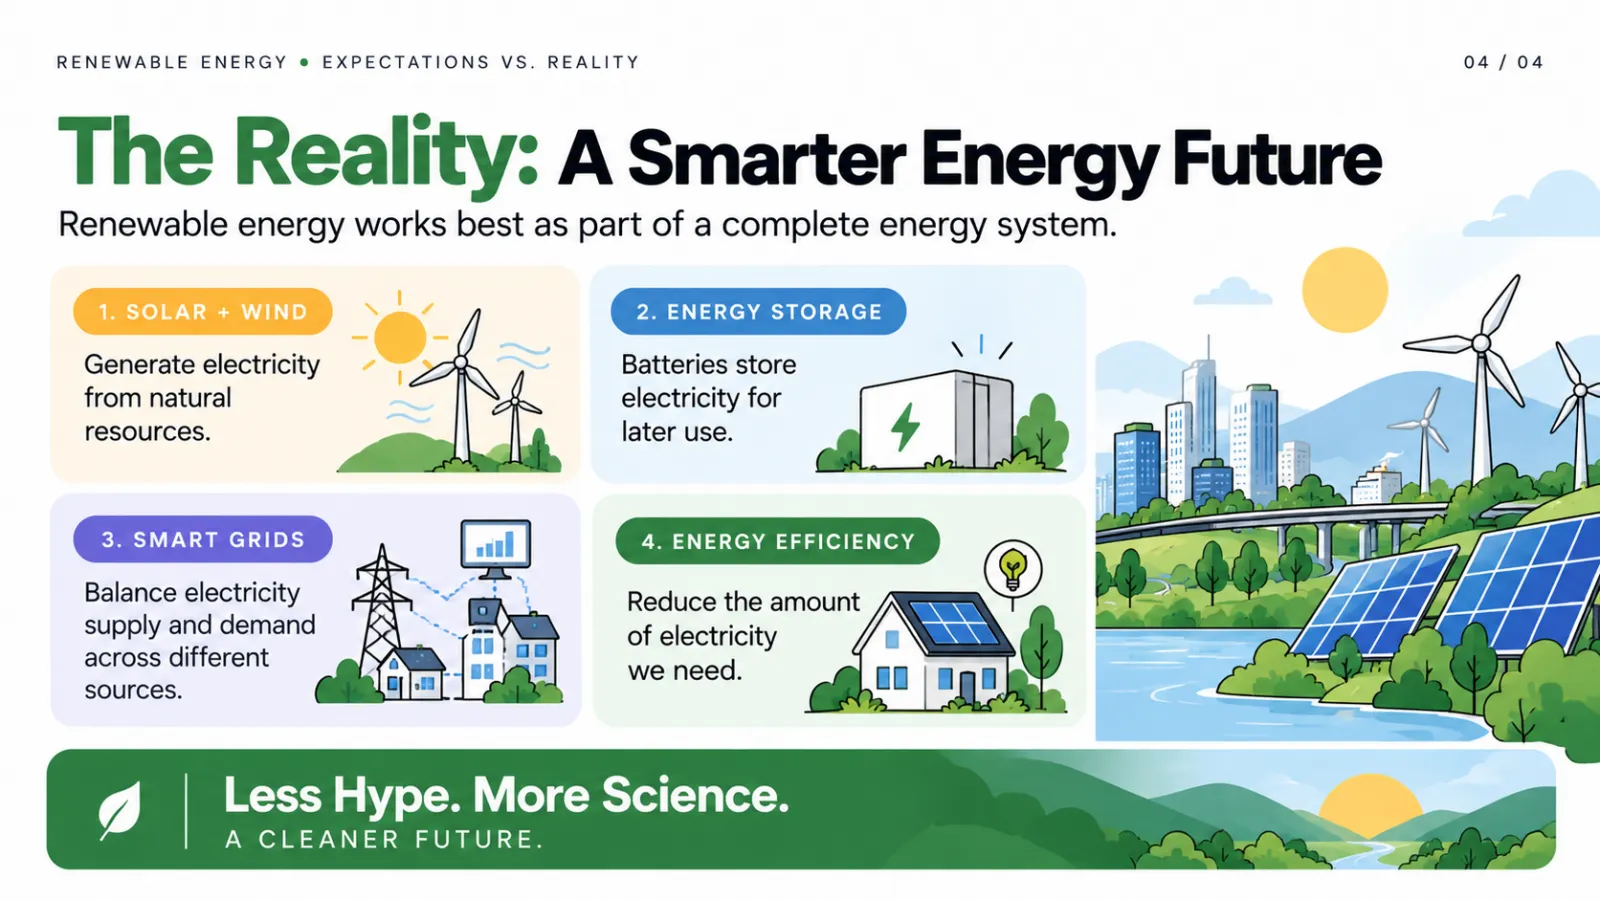
- Mix the sources. In Britain, wind output is usually higher in winter and solar output in summer, so a mix smooths out some of the ups and downs.
- Store energy. The installed cost of a four-hour utility-scale battery fell by about 30% in 2025 to roughly USD 140 per kWh, around 95% below 2010, according to IRENA. Ember estimates that battery storage deployment grew 46% in 2025 to about 250 GWh worldwide, and IRENA reports that around a quarter of new utility-scale solar was paired with storage. Pumped-storage hydropower, which pumps water uphill when power is cheap and releases it through turbines later, is the other big store.
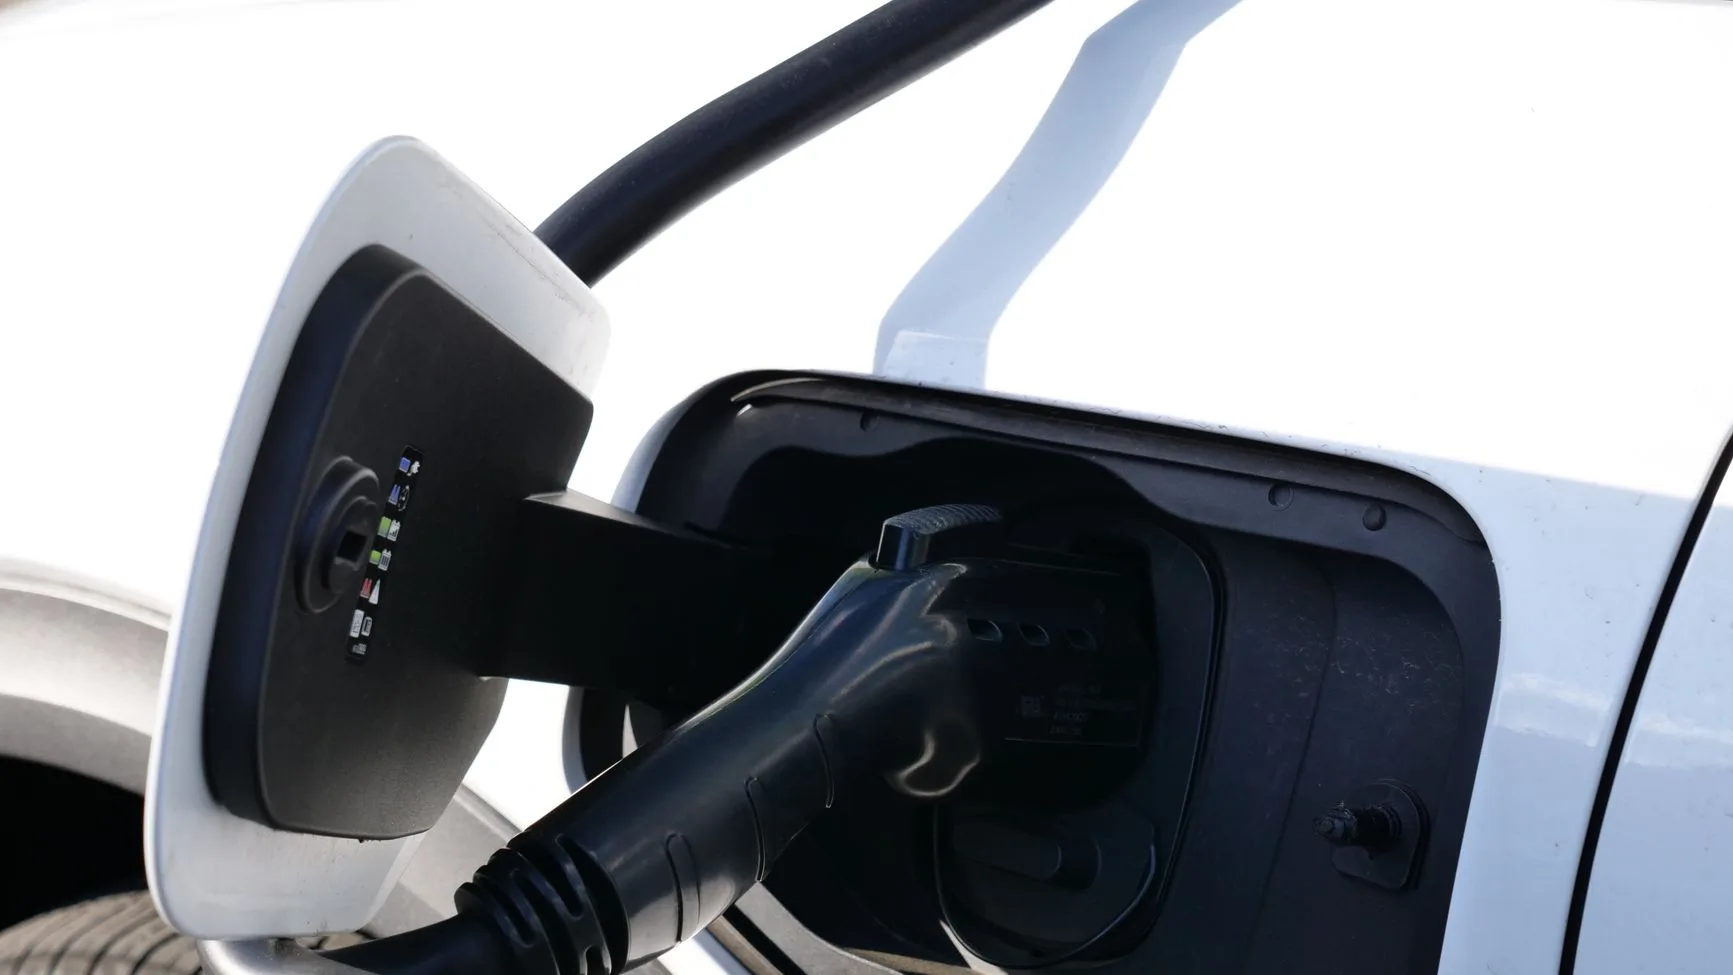
- Make the grid smarter and demand flexible. Interconnectors link countries so they can share power, and smart meters and tariffs can encourage people to run appliances, charge electric cars and warm heat pumps when power is plentiful. Our explainer on how electric cars work shows why a car battery can help balance the grid as well as drive.
- Use less in the first place. The cheapest energy is the energy you never need, so insulation and efficient appliances shrink the gap that supply has to fill.
For long gaps, a reliable system also keeps dispatchable backup, meaning power stations that can be switched on when needed, such as gas, biomass, hydro and nuclear. How much of each is needed is a major question for energy planners.
The grid bottleneck
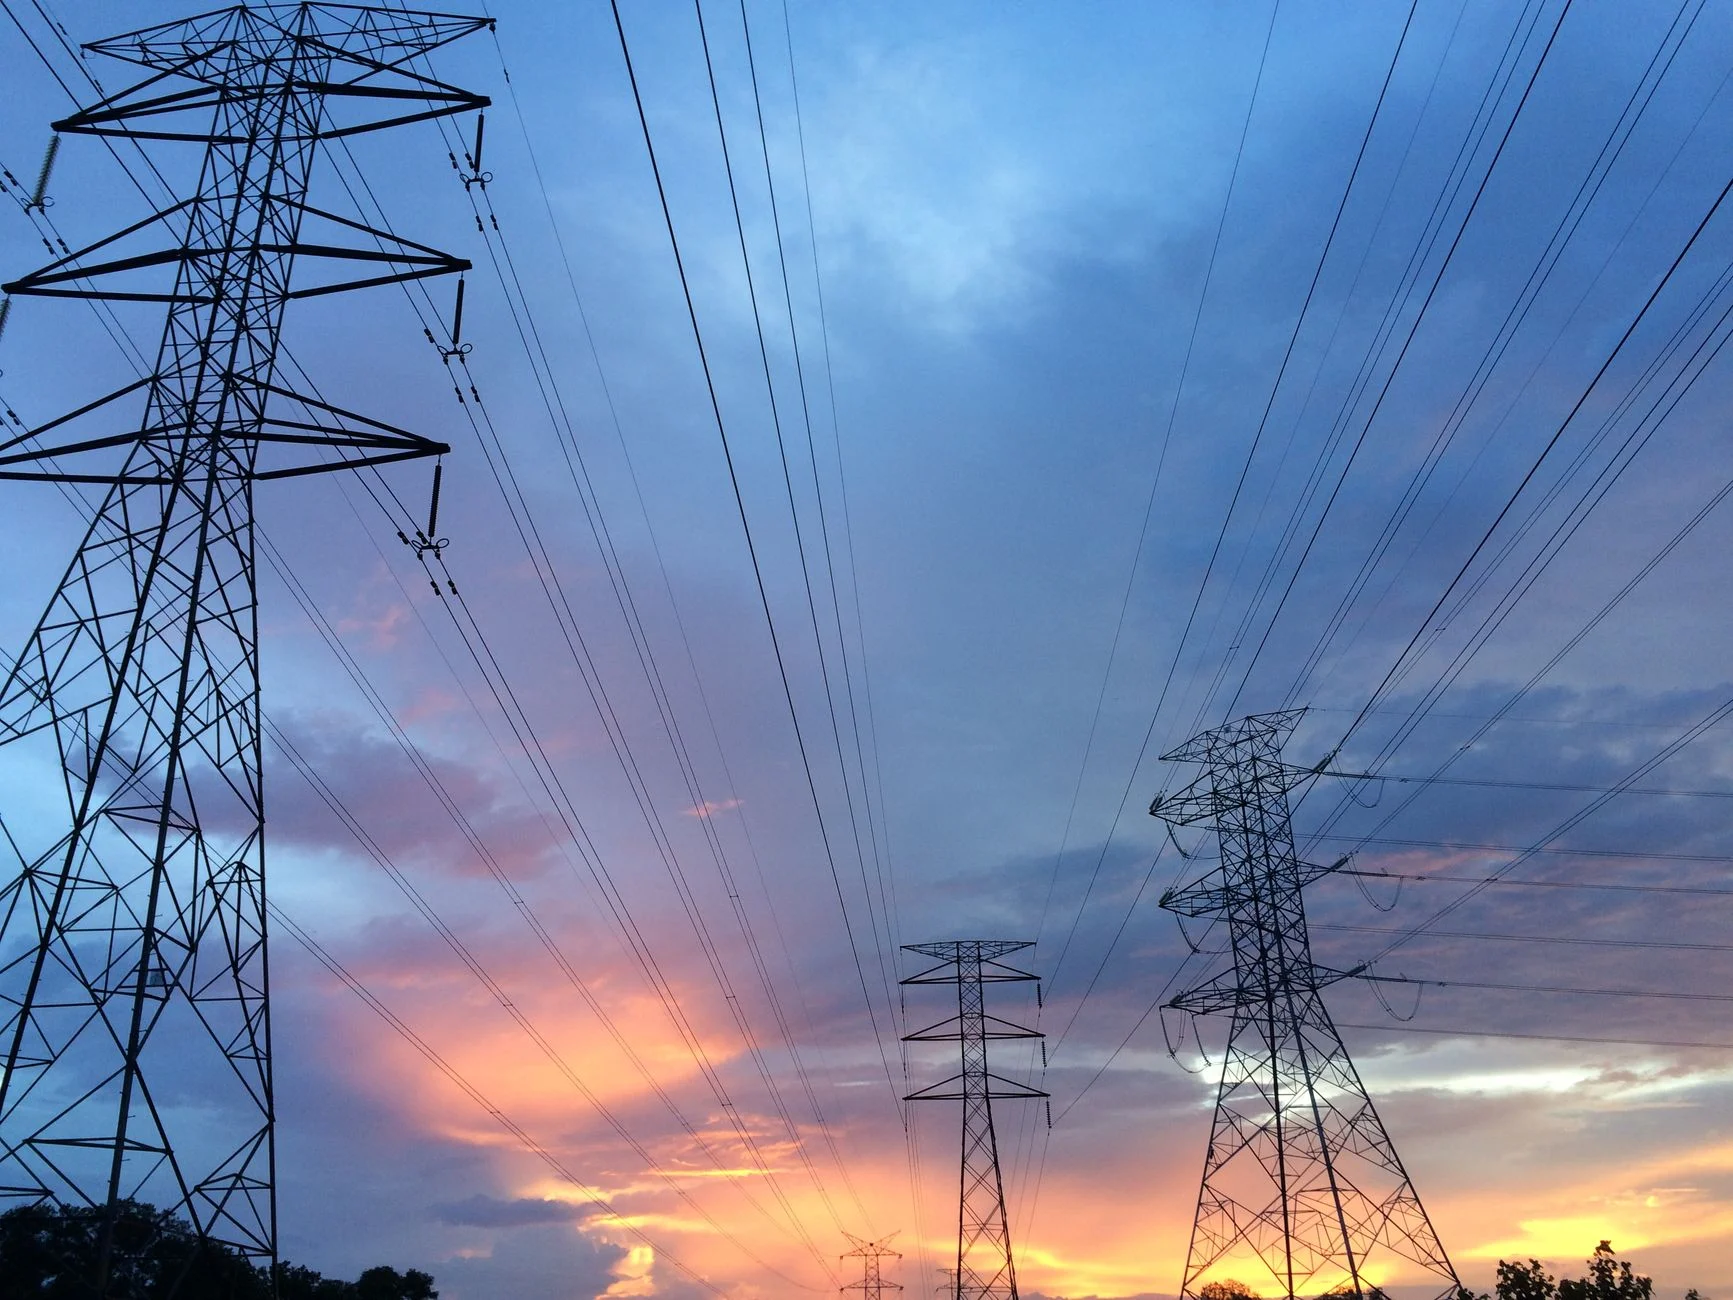
Sometimes the problem is not a lack of power but nowhere to send it. A study from the UK Energy Research Centre (UKERC) found that constraint costs came to £1.65 billion in the 15 months from January 2024 to April 2025. Most of that was wind power in Scotland that the transmission network could not carry south to where demand is. Wind farms are paid to switch off, and power stations elsewhere, often gas, are paid to generate instead. Roughly £58 billion or more of new transmission investment is planned in Great Britain by 2035 to ease the problem.
Can the UK run on clean power?
The government's Clean Power 2030 Action Plan, published in December 2024, sets a target for clean sources, including renewables, nuclear and carbon capture, to supply at least 95% of Great Britain's electricity in a typical weather year by 2030. It also aims to cut the carbon intensity of electricity from 171 gCO₂e/kWh in 2023 to well below 50 g. This is a target, not a guarantee. Meeting it depends on new grid connections, storage and flexible demand arriving on time.
When projects fail: the solar road
Not every renewable idea works. In December 2016 a village in Normandy, France, opened a 1 km road surfaced with solar panels at a cost of about €5 million. Between December 2016 and March 2019 it generated 229 MWh, against a forecast of 642 MWh. The panels suffered from noise and wear, the speed limit had to be cut to 70 km/h, and a local official called the project an economic and financial failure.
The lesson is that solar panels work best where they are tilted at the Sun, kept clean and left alone, such as on roofs and in fields. Panels lying flat, shaded and driven over lose output. Our guide to solar panel function and maintenance explains how dirt and shade cut performance.
Green jobs: expectation met?
Renewable energy has created a lot of work. The International Renewable Energy Agency and the International Labour Organization estimate 16.6 million renewable energy jobs worldwide in 2024, with solar PV accounting for 7.24 million, more than 43% of the total. But job growth slowed to 2.3%, with automation, overcapacity and grid bottlenecks among the reasons, and China accounts for about 58% of solar PV jobs.
How to judge a renewable energy headline
Tick off these questions the next time you read a claim about renewables. Your ticks are remembered in your browser.
- Is it about electricity, or about all energy including heat and transport?
- Is it quoting capacity (MW) or energy actually generated (MWh)?
- Which year and which source is the number from?
- Does it cover the whole life cycle or only the operating phase?
- Is it an average over a year or the position at the moment of peak demand?
- Is it the cost to build the plant, or the bill you pay?
Flip the cards
Frequently asked questions about renewable energy expectations vs reality
What is renewable energy?
Renewable energy comes from natural sources that are replenished faster than we use them, such as sunlight, wind, flowing water, tides, waves, geothermal heat and bio-fuel. Fossil fuels are non-renewable because they take hundreds of millions of years to form. Renewable does not automatically mean zero-carbon, because making equipment and burning biomass produce emissions.
How much of the UK's electricity comes from renewable energy?
In 2025 renewables generated a record 153.0 TWh, which was 52.1% of UK electricity generation, according to the government's DUKES 2026 statistics. Offshore wind was the largest source at 52.0 TWh. Across all UK energy, including heating and transport, renewables supplied a much smaller 16.8%.
Is renewable energy really free?
The fuel is free, because sunlight and wind cost nothing. The equipment is not: panels, turbines, batteries and power lines must be manufactured, installed, maintained and eventually replaced. That is why engineers compare sources using the levelised cost of electricity, which averages all those costs over a plant's lifetime.
Is renewable energy cheaper than fossil fuels?
For new power plants, usually yes. IRENA found that more than 90% of new utility-scale renewable capacity in 2025 produced electricity more cheaply than the cheapest new fossil alternative. Onshore wind averaged USD 33 per MWh and solar PV USD 44. Bills also include network, balancing and policy costs, so cheaper generation does not always mean cheaper bills.
Why is renewable energy not always reliable?
Wind and solar output depends on the weather. Solar produces nothing at night and little in winter, and wind speeds change hour by hour, so these sources run well below full capacity. Storage, interconnectors, flexible demand and dispatchable backup such as gas, hydro, biomass or nuclear fill the gaps. Tides are predictable, and hydro and geothermal are steadier.
What is a load factor (capacity factor)?
A load factor is the electricity a power plant actually generates over a period, divided by what it could generate running flat out. In the UK in 2025 it was 36.4% for offshore wind, 24.1% for onshore wind and 11.1% for solar PV. Yearly energy equals capacity × 8,760 hours × load factor.
Is renewable energy completely clean?
No, but it is far cleaner than fossil fuels. IPCC life-cycle medians are about 11 g CO₂eq per kWh for onshore wind and 41–48 g for solar PV, compared with 490 g for gas and 820 g for coal. Mining, manufacturing, land use and end-of-life recycling still have environmental costs.
Do wind turbines kill a lot of birds?
US Fish and Wildlife Service estimates (as of 2017) suggest about 234,000 birds a year die at land-based wind turbines. That compares with about 2.4 billion killed by cats and 599 million by collisions with building glass. Turbines are a small cause overall, but sites still need careful planning, especially on migration routes.
Can renewable energy replace fossil fuels completely?
Not yet. Renewables are over half of UK electricity but only 16.8% of all UK energy, and global fossil CO₂ emissions were projected to reach a record 38.1 billion tonnes in 2025. Replacing fossil fuels needs clean heating and transport, more storage and stronger grids, as well as more wind and solar.